Showing posts with label but is it true. Show all posts

Thursday, March 28, 2013

Where Do the Rich Get Their Money, Again?

This was an early topic at the Slack Wire, but worth revisiting.

There's this widespread idea that the rich today are no different from us. We no longer have the pseudo-aristocratic rentiers of Fitzgerald or Henry James, but hard-working (if perhaps overcompensated) superstars of the labor market. When a highbrow webzine does an "interview with a rich person," it turns out to be a successful graphic designer earning $140,000 a year.

Sorry, that is not a rich person.

The 1 percent cutoff for household income is around $350,000. The 0.1 percent, around $2 million. The 0.01 percent, around $10 million. Those are rich people, and they're not graphic designers, or even lawyers or bankers. They're owners.

From the IRS Statistics of Income for 2010:


Wages and Salaries Pensions, Social Security, UI Interests, Dividends, Inheritance Business Income Capital Gains Total Capital Income

Total 64.5% 18.5% 6.1% 7.2% 3.8% 17.1%

Median Household 72.7% 21.5% 2.4% 2.4% 0.0% 4.8%

The 0.01% 14.6% 0.7% 23.1% 19.0% 40.6% 82.7%


As we can see, for households at the very top of the distribution, income overwhelmingly comes from property ownership. Total property income at the far right, the sum of preceding three columns. (The numbers don't add to quite 100% because I've left out a few small, hard-to-classify categories like alimony and gambling winnings.) The top 0.01 percent's 15 percent of labor income is not much more than the same stratum got from wages and salaries in 1929. No doubt many of these people spend time at an office of some kind, but the idea of "the working rich" is a myth.

Here's the same breakdown across the income distribution. The X-axis is adjusted gross income.


So across a broad part of the income distribution, wages make up a stable 70-75 percent of income, with public and private social insurance providing most of the rest. Capital income catches up with labor income around $500,000, making the one percent line a good qualitative as well as quantitative cutoff. It's interesting to see how business income peaks in the $1 to $2 million range, the signature of the old middle class or petite bourgeoisie. And at the top, again, capital income is absolutely dominant.

It's an interesting question why this isn't more widely recognized. Mainstream discussions of rising inequality take it for granted that “those at the top were more likely to earn than inherit their riches," with the clear understanding that "earn" means a paycheck. Even very smart Marxists like Gerard Dumenil and Dominique Levy concede that "a large fraction of the income of the wealthiest segments of the population is made of wages," giving a figure of 48.8 percent for the wage share of the top 0.1 percent. Yet the IRS figures show that the wage share for this stratum is not nearly half, but less than a third. What gives?

I think at least some of the confusion is the fault of Piketty and Saez. Their income distribution work is state of the art, they've done as much as anyone to bring the concentration of income at the top into public discussion; I'd be a fool to criticize their work on the substance. They do, however, make a somewhat peculiar choice about presentation. In the headline numbers in much of their work, they give not the top 0.01, 0.1, 1, etc. percent by income, but rather the top percentiles by income excluding capital gains. [*] This is clearly stated in their papers but it is almost never noted, as far as I can tell, by people who cite them.

There are various good reasons, in principle, for distinguishing capital gains from other income. But in an era when capital gains are the largest single source of income at the top, defining top income fractiles  excluding capital gains seriously distorts your picture of the very top. For instance, you may miss people like this guy: In both 2010 and 2011, the majority of Mitt Romney's income took the form of capital gains.

"They have taken untold millions that they never toiled to earn," or if you prefer, "Save your money -- same like yesterday."


[*] The fractiles are defined this way even when capital gains income is reported. You have to dig around a bit in their data to find the composition of income by raw income fractiles, equivalent to my table above.

Thursday, July 26, 2012

Does the Fed Control Interest Rates?

Casey Mulligan goes to the New York Times to say that monetary policy doesn't work. This annoys Brad DeLong:
THE NEW YORK TIMES PUBLISHES CASEY MULLIGAN AS A JOKE, DOESN'T IT? 
... The third joke is the entire third paragraph: since the long government bond rate is made up of the sum of (a) an average of present and future short-term rates and (b) term and risk premia, if Federal Reserve policy affects short rates then--unless you want to throw every single vestige of efficient markets overboard and argue that there are huge profit opportunities left on the table by financiers in the bond market--Federal Reserve policy affects long rates as well. 
Casey B. Mulligan: Who Cares About Fed Funds?: New research confirms that the Federal Reserve’s monetary policy has little effect on a number of financial markets, let alone the wider economy…. Eugene Fama of the University of Chicago recently studied the relationship between the markets for overnight loans and the markets for long-term bonds…. Professor Fama found the yields on long-term government bonds to be largely immune from Fed policy changes…
Krugman piles on [1]; the only problem with DeLong's post, he says, is that
it fails to convey the sheer numbskull quality of Mulligan’s argument. Mulligan tries to refute people like, well, me, who say that the zero lower bound makes the case for fiscal policy. ... Mulligan’s answer is that this is foolish, because monetary policy is never effective. Huh? 
... we have overwhelming empirical evidence that monetary policy does in fact “work”; but Mulligan apparently doesn’t know anything about that.
Overwhelming evidence? Citation needed, as the Wikipedians say.

Anyway, I don't want to defend Mulligan -- I haven't even read the column in question -- but on this point, he's got a point. Not only that: He's got the more authentic Keynesian position.

Textbook macro models, including the IS-LM that Krugman is so fond of, feature a single interest rate, set by the Federal Reserve. The actual existence of many different interest rates in real economies is hand-waved away with "risk premia" -- market rates are just equal to "the" interest rate plus a prmium for the expected probability of default of that particular borrower. Since the risk premia depnd on real factors, they should be reasonably stable, or at least independent of monetary policy. So when the Fed Funds rate goes up or down, the whole rate structure should go up and down with it. In which case, speaking of "the" interest rate as set by the central bank is a reasonable short hand.

How's that hold up in practice? Let's see:


The figure above shows the Federal Funds rate and various market rates over the past 25 years. Notice how every time the Fed changes its policy rate (the heavy black line) the market rates move right along with it?

Yeah, not so much.

In the two years after June 2007, the Fed lowered its rate by a full five points. In this same period, the rate on Aaa bonds fell by less 0.2 points, and rates for Baa and state and local bonds actually rose. In a naive look at the evidence, the "overwhelming" evidence for the effectiveness of monetary policy is not immediately obvious.

Ah but it's not current short rates that long rates are supposed to follow, but expected short rates. This is what our orthodox New Keynesians would say. My first response is, So what? Bringing expectations in might solve the theoretical problem but it doesn't help with the practical one. "Monetary policy doesn't work because it doesn't change expectations" is just a particular case of "monetary policy doesn't work."

But it's not at all obvious that long rates follow expected short rates either. Here's another figure. This one shows the spreads between the 10-Year Treasury and the Baa corporate bond rates, respectively, and the (geometric) average Fed Funds rate over the following 10 years.


If DeLong were right that "the long government bond rate is made up of the sum of (a) an average of present and future short-term rates and (b) term and risk premia" then the blue bars should be roughly constant at zero, or slightly above it. [2] Not what we see at all. It certainly looks as though the markets have been systematically overestimating the future level of the Federal Funds rate for decades now. But hey, who are you going to believe, the efficient markets theory or your lying eyes? Efficient markets plus rational expectations say that long rates must be governed by the future course of short rates, just as stock prices must be governed by future flows of dividends. Both claims must be true in theory, which means they are true, no matter how stubbornly they insist on looking false.

Of course if you want to believe that the inherent risk premium on long bonds is four points higher today than it was in the 1950s, 60s and 70s (despite the fact that the default rate on Treasuries, now as then, is zero) and that the risk premium just happens to rise whenever the short rate falls, well, there's nothing I can do to stop you.

But what's the alternative? Am I really saying that players in the bond market are leaving huge profit opportunities on the table? Well, sometimes, maybe. But there's a better story, the one I was telling the other day.

DeLong says that if rates are set by rational, profit-maximizing agents, then -- setting aside default risk -- long rates should be equal to the average of short rates over their term. This is a standard view, everyone learns it. but it's not strictly correct. What profit-maximizing bond traders do, is set long rates equal to the expected future value of long rates.

I went through this in that other post, but let's do it again. Take a long bond -- we'll call it a perpetuity to keep the math simple, but the basic argument applies to any reasonably long bond. Say it has a coupon (annual payment) of $40 per year. If that bond is currently trading at $1000, that implies an interest rate of 4 percent. Meanwhile, suppose the current short rate is 2 percent, and you expect that short rate to be maintained indefinitely. Then the long bond is a good deal -- you'll want to buy it. And as you and people like you buy long bonds, their price will rise. It will keep rising until it reaches $2000, at which point the long interest rate is 2 percent, meaning that the expected return on holding the long bond and rolling over short bonds is identical, so there's no incentive to trade one for the other. This is the arbitrage that is supposed to keep long rates equal to the expected future value of short rates. If bond traders don't behave this way, they are missing out on profitable trades, right?

Not necessarily. Suppose the situation is as described above -- 4 percent long rate, 2 percent short rate which you expect to continue indefinitely. So buying a long bond is a no-brainer, right? But suppose you also believe that the normal or usual long rate is 5 percent, and that it is likely to return to that level soon. Maybe you think other market participants have different expectations of short rates, maybe you think other market participants are irrational, maybe you think... something else, which we'll come back to in a second. For whatever reason, you think that short rates will be 2 percent forever, but that long rates, currently 4 percent, might well rise back to 5 percent. If that happens, the long bond currently trading for $1000 will fall in price to $800. (Remember, the coupon is fixed at $40, and 5% = 40/800.) You definitely don't want to be holding a long bond when that happens. That would be a capital loss of 20 percent. Of course every year that you hold short bonds rather than buying the long bond at its current price of $1000, you're missing out on $20 of interest; but if you think there's even a moderate chance of the long bond falling in value by $200, giving up $20 of interest to avoid that risk might not look like a bad deal.

Of course, even if you think the long bond is likely to fall in value to $800, that doesn't mean you won't buy it for anything above that. if the current price is only a bit above $800 (the current interest rate is only a bit below the "normal" level of 5 percent) you might think the extra interest you get from buying a long bond is enough to compensate you for the modest risk of a capital loss. So in this situation, the equilibrium price of the long bond won't be at the normal level, but slightly below it. And if the situation continues long enough, people will presumably adjust their views of the "normal" level of the long bond to this equilibrium, allowing the new equilibrium to fall further. In this way, if short rates are kept far enough from long rates for long enough, long rates will eventually follow. We are seeing a bit of this process now. But adjusting expectations in this way is too slow to be practical for countercyclical policy. Starting in 1998, the Fed reduced rates by 4.5 points, and maintained them at this low level for a full six years. Yet this was only enough to reduce Aaa bond rates (which shouldn't include any substantial default risk premium) by slightly over one point.

In my previous post, I pointed out that for policy to affect long rates, it must include (or be believed to include) a substantial permanent component, so stabilizing the economy this way will involve a secular drift in interest rates -- upward in an economy facing inflation, downward in one facing unemployment. (As Steve Randy Waldman recently noted, Michal Kalecki pointed this out long ago.) That's important, but I want to make another point here.

If the primary influence on current long rates is the expected future value of long rates, then there is no sense in which long rates are set by fundamentals.  There are a potentially infinite number of self-fulfilling expected levels for long rates. And again, no one needs to behave irrationally for these conventions to sustain themselves. The more firmly anchored is the expected level of long rates, the more rational it is for individual market participants to act so as to maintain that level. That's the "other thing" I suggested above. If people believe that long rates can't fall below a certain level, then they have an incentive to trade bonds in a way that will in fact prevent rates from falling much below that level. Which means they are right to believe it. Just like driving on the right or left side of the street, if everyone else is doing it it is rational for you to do it as well, which ensures that everyone will keep doing it, even if it's not the best response to the "fundamentals" in a particular context.

Needless to say, the idea that that long-term rate of interest is basically a convention straight from Keynes. As he puts it in Chapter 15 of The General Theory,
The rate of interest is a highly conventional ... phenomenon. For its actual value is largely governed by the prevailing view as to what its value is expected to be. Any level of interest which is accepted with sufficient conviction as likely to be durable will be durable; subject, of course, in a changing society to fluctuations for all kinds of reasons round the expected normal. 
You don't have to take Keynes as gospel, of course. But if you've gotten as much mileage as Krugman has out of the particular extract of Keynes' ideas embodied in the IS-LM mode, wouldn't it make sense to at least wonder why the man thought this about interest rates, and if there might not be something to it.

Here's one more piece of data. This table shows the average spread between various market rates and the Fed Funds rate.


Spreads over Fed Funds by decade

10-Year Treasuries Aaa Corporate Bonds Baa Corporate Bonds State & Local Bonds
1940s
2.2 3.3
1950s 1.0 1.3 2.0 0.7
1960s 0.5 0.8 1.5 -0.4
1970s 0.4 1.1 2.2 -1.1
1980s 0.6 1.4 2.9 -0.9
1990s 1.5 2.6 3.3 0.9
2000s 1.5 3.0 4.1 1.8


Treasuries carry no default risk; a given bond rating should imply a fixed level of default risk, with the default risk on Aaa bonds being practically negligible. [3] Yet the 10-year treasury spread has increased by a full point and the corporate bond rates by about two points, compared with the postwar era. (Municipal rates have risen by even more, but there may be an element of genuine increased risk there.) Brad DeLong might argue that society's risk-bearing capacity has decline so catastrophically since the 1960s that even the tiny quantum of risk in Aaa bonds requires two full additional points of interest to compensate its quaking, terrified bearers. And that this has somehow happened without requiring any more compensation for the extra risk in Baa bonds relative to Aaa. I don't think even DeLong would argue this, but when the honor of efficient markets is at stake, people have been known to do strange things.

Wouldn't it be simpler to allow that maybe long rates are not, after all, set as "the sum of (a) an average of present and future short-term rates and (b) [relatively stable] term and risk premia," but that they follow their own independent course, set by conventional beliefs that the central bank can only shift slowly, unreliably and against considerable resistance? That's what Keynes thought. It's what Alan Greenspan thinks. [4] And also it's what seems to be true, so there's that.


[1] Prof. T. asks what I'm working on. A blogpost, I say. "Let me guess -- it says that Paul Krugman is great but he's wrong about this one thing." Um, as a matter of fact...

[2] There's no risk premium on Treasuries, and it is not theoretically obvious why term premia should be positive on average, though in practice they generally are.

[3] Despite all the -- highly deserved! -- criticism the agencies got for their credulous ratings of mortgage-backed securities, they do seem to be good at assessing corporate default risk. The cumulative ten-year default rate for Baa bonds issued in the 1970s was 3.9 percent. Two decades later, the cumulative ten-year default rate for Baa bonds issued in the 1990s was ... 3.9 percent. (From here, Exhibit 42.)

[4] Greenspan thinks that the economically important long rates "had clearly delinked from the fed funds rate in the early part of this decade." I would only add that this was just the endpoint of a longer trend.


Friday, February 17, 2012

Pity the Landlord

So, speaking of rent control, here's an article on San Francisco's system. It's pretty much the usual -- the headline bleats that rent control "subsidizes the super rich," a claim for which no evidence is presented unless you count an income of $100,000 as super-rich, which in San Francisco, um, no. And then there's the sob stories of "mom and pop" landlords. Apparently, by some unexplained moral calculus, because some landlords own just a few units and have blue-collar backgrounds, the City of San Francisco should pursue higher rents as a policy goal.
Noni Richen, a former school cafeteria cook, and her husband, who once worked on the Alaskan pipeline, put their life savings into buying a four-unit Western Addition apartment building in the 1980s. “We had $20,000,” Richen said. “That was a lot of money to us, and we put that down.”
I am, let's say, unsympathetic. (How much do you think that building is worth today?) But from another perspective, this is directly relevant to the previous post. There are strong political as well as market pressures that keep asset returns above some minimum acceptable level. Is Noni Richen the liquidity trap? In a sense, yes, she is.

Anyway!

That's not what I'm writing about. What I'm writing about is the claim that a large share of rent-regualted units are occupied by high-income households, making it a perverse form of redistribution. Is that true?

I don't know about San Francisco, but in New York this is an easy question to answer. The city's Housing and Vacancy Survey gives very detailed breakdown of rental units by rent regulation status, including the residents' incomes. And... here we go:

Income
Rent-Regulated Apartments
Market-Rate Apartments
All Households
under $25,000
37.3%
27.3%
27.9%
$25,000 to $50,000
25.6%
25.5%
22.1%
$50,000 to $100,000
25.2%
28.3%
27.0%
over $100,000
6.7%
12.1%
23.1%
Median
35,531
46,000
50,038
Mean
52,157
71,307
77,940

In other words, compared with the city as a whole, rent-regulated tenants are only moderately more likely to be poor, but they are much, much less likely to be rich. So can we nip this meme in the bud, before it spreads to the East Coast? Rent control is not a subsidy for super-rich tenants at the expense of their hardscrabble landlords. It's a way of stabilizing middle-class and working-class neighborhoods in the face of gentrification, just like it says on the tin.

Saturday, October 29, 2011

Are Wages Too High?

Here's a good one for the right-for-the-wrong-reasons file.

David Glasner is one of an increasing number of Fed critics who would like to see a higher inflation target. Today, he takes aim at a Wall Street Journal editorial that claims that the real victims of cheaper money wouldn't be, you know, people who own money -- creditors -- as one might think, but working people. Higher inflation just means lower real wages, says the Journal. Crocodile tears, says Glasner -- since when does the Journal care about wage workers? So far, so good, says me.

"What makes this argument so disreputable,"he goes on,
is not just the obviously insincere pretense of concern for the welfare of the working class, but the dishonest implication that employment in a recession or depression can be increased without an, at least temporary, reduction in real wages. Rising unemployment during a contraction implies that real wages are, in some sense, too high, so that a falling real wage tends to be a characteristic of any recovery, at least in its early stages. The only question is whether the falling real wage is brought about through prices rising faster than wages or by wages falling faster than prices. If the Wall Street Journal and other opponents of rising prices don’t want prices to erode real wages, they are ipso facto in favor of falling money wages.
And here we have taken a serious wrong turn.

Glasner is certainly not alone in thinking that rising prices are associated with falling real wages, and vice versa. And he's also got plenty of company in his belief that since the wage is equal to the marginal product of labor, and marginal products should decline, in the short run higher employment implies a lower real wage. But is he right? Is it true that if employment is to rise, "the only question" is whether wages fall directly or via inflation? Is it true that unemployment necessarily means that wages are too high?

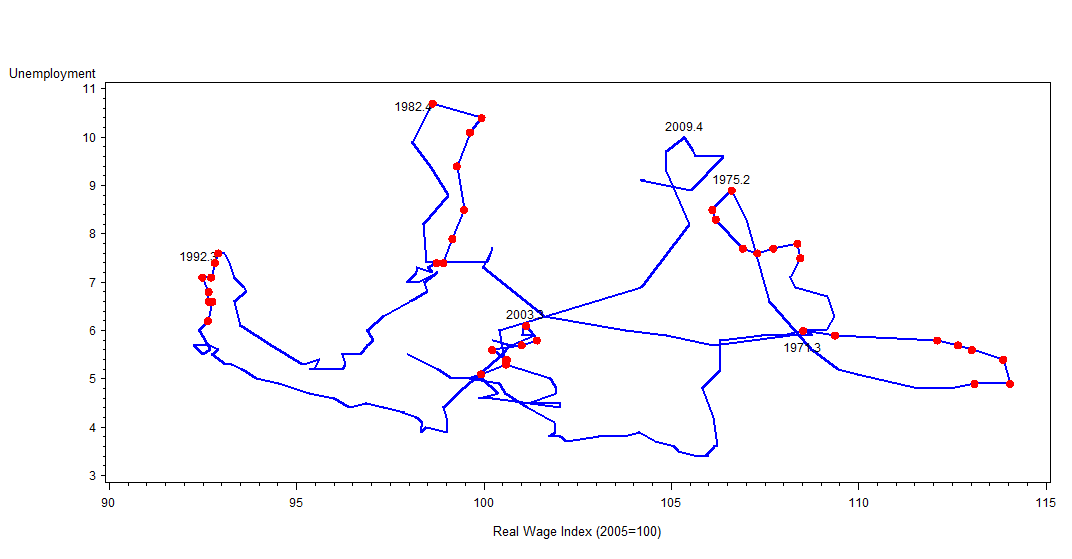
Empirically, it seems questionable. Let's look at unemployment and wages in the past few decades in the United States. The graph below shows the real hourly wage on the x-axis and the unemployment rate on the y-axis. The red dots show the two years after the peak of unemployment in each of the past five recessions. If reducing unemployment always required lower real wages, the red dots should consistently make upward sloping lines. The real picture, though, is more complicated.

As we can see, the early 2000s recovery and, arguably, the early 1980s recovery were associated with falling real wages. but in the early 1990s, employment recovered with constant real wages -- that's what the vertical line over on the left means. And in the two recessions of the 1970s, the recoveries combined falling unemployment with strongly rising real wages. If we look at other advanced countries, it's this last pattern we see most often. (I show some examples after the fold.) So while rising employment is sometimes accompanied by a falling real wage, it is clearly not true that, as Glasner claims, it necessarily must be.

This is an important question to get straight. There seems to be a certain convergence happening between progressive-liberal economists and neo-monetarists like Glasner on the desirability of higher inflation in general and nominal GDP targeting in particular. There's something to be said for this; inflation is the course of least resistance to cancel the debts. But we in the party of movement can't support this idea or make it part of a broader popular economic program if it's really a stalking horse for lower wages.

Fortunately, the macroeconomic benefits of a rising price level don't depend on a falling real wage.

Saturday, August 13, 2011

A History of Debt/GDP

"Probably more uninformed statements have been made on public-sector debt and deficits," says Willem Buiter, "than on any other subject in macroeconomics. Proof by repeated assertion has frequently appeared to be an acceptable substitute for proof by deduction or proof by induction."

It's hard to disagree. 

But at least we know where an informed discussion starts. It starts from the least controversial equation of macroeconomics, the law of motion of public debt:

b is the ratio of public debt to GDP, d is the ratio of primary deficit to GDP, i is the nominal interest rate, g is the real growth rate of GDP, and pi is inflation. In principle this is true by definition. (In practice things aren't alway so simple.) The first thing you realize, looking at this equation, is that contrary to the slack-jawed bleating of conventional opinion, there's no necessary connection between the evolution of public debt and government spending and taxes. Interest rates, growth rates and inflation are, in principle, just as important as the primary balance. Which naturally invites the question, which have been more important in practice?

There have been various efforts to answer this question for different countries in different periods, but until recently there wasn't any systematic effort to answer it for a broad sample of countries over a long period. I was thinking of trying to do such an exercise myself. But it looks like that's not necessary. As Tom M. points out in comments,  the IMF has just undertaken such an exercise. Using the new Historical Public Debt Database, they've decomposed the debt-GDP ratios of 174 countries, from 1880 to the present, into the four components of the law of motion. (Plus a fifth, discussed below.) It's an impressive project. Ands far as one can tell from this brief presentation, they did it right. Admittedly it's a laconic 25-page powerpoint, but there's not even the hint of a suggestion that microfoundations or welfare analysis would contribute anything. The question is just, how much has each of the components contributed to shifts in debt-GDP ratios historically?

As I've noted here before, the critical issue is the relationship between g and i, or (g + pi) and i as I've written it here. On this point, the IMF study gives ammunition to both sides.


From roughly 1895 to 1920, and from 1935 to 1980, nominal growth rates (g + pi) generally exceeded nominal interest rates. From 1880 to 1895, from 1920 to 1935, and from 1980 to the present, interest mostly exceeded growth. It's impossible, looking at this picture, to say one relationship or the other is normal. Lernerian-Keynesians will say, why can't the conditions of the postwar decades be reproduced by any government that chooses to; while the orthodox (Marxists and neoclassicals equally) will say the postwar decades were anomalous for various reasons -- financial repression, limited international mobility of capital, exceptionally strong growth. The historical evidence doesn't clearly resolve the question either way.

Given the unstable relationship between g and i, it's not surprising there's no consistent pattern in episodes of long-term reduction in debt-GDP ratios. I had hoped such episodes would turn out to be always, or almost always, the result of faster growth, lower interest rates, and higher inflation. This is basically true for the postwar decades, when the biggest debt reductions happened. Since 1980, though, it seems that countries that have reduced their debt-GDP ratios have done it the hard way, by taxing more than they spent. Over the whole period since 1880, periods of major (at least 10 percent of GDP) debt reduction has involved primary surpluses and g > r in about equal measure.


Another interesting point is how much the law of motion turns out to have exceptions. The IMF's version of the equation above includes an additional term on the right side: SFA, or stock-flow adjustment, meaning the discrepancy between the flow of debt implied by the other terms of the equation and the stock of debt actually observed. This discrepancy turns out to be often quite large. This could reflect a lot of factors; but for recent episodes of rising debt-GDP ratios (in which SFA seems to play a central role) the obvious interpretation is that it reflects the assumption by the government of the banking system's debts, which is often not reflected in official deficit statistics but may be large relative to the stock of debt. The extreme case is Ireland, where the government guarantee of the financial system resulted in the government assuming bank liabilities equal to 45 percent of GDP. To the extent this is an important factor in rising public debt generally -- and again, the IMF study supports it -- it suggests another reason why concern with balancing the long-term budget by "reforming" Medicare, etc., is misplaced. One financial crisis can cancel out decades of fiscal rectitude; so if you're concerned about what the debt-GDP ratio will be in 2075, you should spend less time thinking about public spending and taxes, and much more time thinking about effective regulation of the financial sector.

The bottom line is, the dynamics of public debt are complicated. But as always, intractable theoretical controversies become more manageable, or at least more meaningful, when they're posed as concrete historical questions. Good on the IMF for doing this.