Thursday, July 9, 2015
This Blog Is Now at http://jwmason.org/the-slack-wire/
I am leaving this site up, but I won't post any more content here.
Friday, July 3, 2015
Friday, June 26, 2015
OECD: Activist Shareholders Are Bad for Investment
[Cross-posted from the new blog at jwmason.org. Please comment there, and update your bookmarks -- at some point soon I'm going to stop updating this blog.]
The OECD has just released its new Business and Finance Outlook for 2015. A lot of interesting stuff there. We'll want to take a closer look at the discussion of the problems that low interest rates pose for pension funds and insurance companies -- I've thought for a while that this is the most convincing form of the "reaching for yield" argument. But what I want to talk about now is the OECD's apparent endorsement of the "disgorge the cash" thesis.
Chapter 2, "Corporate Investment and the Stagnation Puzzle," has a very interesting discussion of shareholder activism and its effects on investment. The starting point is the puzzle that while participants in financial markets are willing to accept unprecedentedly low returns, the minimum returns on new investment projects remain high, as evidenced by depressed real investment despite sustained low interest rates. I think this apparent puzzle is, precisely, a rediscovery of Keynes' liquidity premium. (Perhaps I will return to this in a subsequent post.) There are a number of ways to think about this, but one dimension is the pressure corporate managers face to avoid investment projects unless the returns are rapid, large, and certain.
The other thing that is notable here is the aggregating of dividends and buybacks in a single "shareholder payout" term. This is what I do, I think it's unambiguously the right thing to do, but in some quarters for some reason it's controversial. So I'm always glad to find another authority to say, a buyback is a dividend, a dividend is a buyback, the end.
Another way to see these two points is to think about so-called dividend recapitalizations. These are when a private equity firm, having taken control of a business, has it issue new debt in order to fund a special dividend payment to themselves. (It's the private equity firm that's being recapitalized here, not the hapless target firm.) The idea of private equity is that the acquired firm will be resold at a premium because of the productive efficiencies brought about by new management. The more or less acknowledged point of a dividend recap is to allow the private equity partners to get their money back even when they have failed to deliver the improvements, and the firm cannot be sold at a price that would allow them to recoup their investment. Dividend recaps are a small though not trivial part of the flow of payments from productive enterprises to money-owners, in recent years totaling between 5 and 10 percent of total dividends. For present purposes, there are two especially noteworthy things about them. First, they are pure value extraction, but they take the form of a dividend rather than a share repurchase. This suggests that if the SEC were to crack down on buybacks, as people Lazonick suggest, it would be easy for special dividends to take their place. Second, they take place at closely held firms, where the managers have been personally chosen by the new owners. It's the partners at Cerberus or Apollo who want the dividends, not their hired guns in the CEO suites. It's an interesting question why the partners want to squeeze these immediate cash payments out of their prey when, you would think, they would just reduce the sale price of the carcass dollar for dollar. But the important point is that here we have a case where there's no entrenched management, no coordination problems among shareholders -- and Lazonick's "downsize-and-distribute" approach to corporate finance is more pronounced than ever.
Back to the OECD report. The chapter has some useful descriptive material, comparing shareholder payouts in different countries.

As you can see, investment is quite stable as a fraction of sales. Shareholder payouts, by contrast, dropped sharply over 2007-2009, and have since recovered even more strongly. Since 2009, US corporations have increased their borrowing ("other financing") by about 4 percent of sales; shareholder payouts have increased by an almost exactly equal amount. This is consistent with my argument that in the shareholder-dominated corporation, real activity is largely buffered from changes in financial conditions. Shifts in the availability of credit simply result in larger or smaller payments to shareholders. The OECD report takes a similar view, that access to credit is not an important factor in variation in corporate investment spending.
The bottom line, though the OECD report doesn't quite put it this way, is that wealth-owners strongly prefer claims on future income that take money-like forms over claims on future incomes exercised through concrete productive activity. [1] This is, again, simply Keynes' liquidity premium, which the OECD authors knowing or unknowingly (but without crediting him) summarize well:
UPDATE: Here's James Mackintosh discussing this same material on "The Short View":
[1] It's worth mentioning here this interesting recent Australian survey of corporate executives, which found that new investment projects are judged by a minimum expected return or hurdle rate that is quite high -- usually in excess of 10 percent -- and not unresponsive to changes in interest rates. Even more interesting for our purposes, many firms report that they evaluate projects not based on a rate of return but on a payback period, often as short as three years.
[2] The language of "M and "P" moments is of course taken from Marx's vision of capital as a process of transformation, from money to commodities to authority over a production process, back to commodities and finally back to money. In Capital Vol. 1 and much of his other writing, Marx speaks of the capitalist as straightforwardly the embodiment of capital, a reasonable simplification given his focus there and the fact that in the 1860s absentee ownership was a rare exception. There is a much more complex discussion of the ways in which the different moments of capital can take the form of distinct and possibly conflicting social actors in Capital Vol. 3, Part 5, especially chapter 27.
The OECD has just released its new Business and Finance Outlook for 2015. A lot of interesting stuff there. We'll want to take a closer look at the discussion of the problems that low interest rates pose for pension funds and insurance companies -- I've thought for a while that this is the most convincing form of the "reaching for yield" argument. But what I want to talk about now is the OECD's apparent endorsement of the "disgorge the cash" thesis.
Chapter 2, "Corporate Investment and the Stagnation Puzzle," has a very interesting discussion of shareholder activism and its effects on investment. The starting point is the puzzle that while participants in financial markets are willing to accept unprecedentedly low returns, the minimum returns on new investment projects remain high, as evidenced by depressed real investment despite sustained low interest rates. I think this apparent puzzle is, precisely, a rediscovery of Keynes' liquidity premium. (Perhaps I will return to this in a subsequent post.) There are a number of ways to think about this, but one dimension is the pressure corporate managers face to avoid investment projects unless the returns are rapid, large, and certain.
Stock markets currently reward companies that favour dividends and buybacks and punish those that undertake more investment … which creates higher hurdle rates for investment.Here in one sentence is the disgorge the cash argument.
Private sector companies in market-based economies allocate capital spending according to shareholder value. Earnings may be retained for capital spending and growth, but only if the return on equity exceeds the cost of equity. If this is not the case then … they will choose to use their operating cash flow in other ways (by issuing dividends, carrying out cash buybacks…) … and in the limit may close plants and shed labor.The bolded sentence is puzzling. Is it description or prescription? (Or description of a prescription?) The rest of the section makes no sense if you think either that this is how corporate investment decisions are made, or if you think it's how they should be made. Among other reasons, once we have different, competing discount rates, the "return on equity" no longer has a well-defined value, even in principle. Throughout, there's a tension between the language of economic theory and the language of concrete phenomena. Fortunately the latter mostly wins out.
The last decade has seen the rising importance of activist investors who gain the support of other investors and proxy advisors to remove management, to gain influential board seats and/or to make sure that company strategy is in the best interest of shareholders… The question arises as to whether the role of such investors is working to cause short-termism strategies [sic] at the expense of long-term investment, by effectively raising the hurdle rate… Activists… favour the short-term gratification of dividends and share buybacks versus longer-term investment. Incumbent managers will certainly prefer giving in to shareholders desire for more ‘yield’ in a low-interest world to taking on the risk of uncertain long-term investment that might cause them to be punished in the share market. ...
To test this idea, an index of CAPEX/(CAPEX + Dividends & Buybacks) was created for each company, and the following investment strategy was measured: sell the highest quartile of the index (capital heavy firms) and buy the lowest quartile of the index (Dividend and Buyback heavy firms). … Selling high capital spending companies and buying low CAPEX and high buyback companies would have added 50% to portfolio values in the USA, 47% in Europe, 21% in emerging economies and even 12% in Japan (where activists play little role). On balance there is a clear investor preference against capital spending companies and in favor of short-termism. This adds to the hurdle rate faced by managers in attempting to undertake large capital spending programmes — stock market investors will likely punish them. … it would be fairly logical from a management point of view to return this cash to shareholders rather than undertake uncertain long-term investment projects... The risks instead would be born more by host-country investment in capacity and infrastructure.This is a useful exercise. The idea is to look at the ratio of investment to shareholder payouts, and ask how the stock price of the high-investment firms performed compared to the high-payout firms, over the six years 2009 through 2014. What they find is that the shares of the high-payout firms performed considerably better. This is important because it undermines the version of the disgorge argument you get from people like Bill Lazonick, in which buybacks deliver a short-term boost the share price that benefits CEOs looking to cash in on their options, but does nothing for longer-term investors. In Lazonick's version of the story, managers are on one side, shareholders, workers and the rest of society on the other. But if high-payout firms perform better for shareholders over a six-year horizon (which in financial-market terms is almost geologically long term) then we have to slice things differently. On one side are shareholders and CEOs, on the other are us regular people.
The other thing that is notable here is the aggregating of dividends and buybacks in a single "shareholder payout" term. This is what I do, I think it's unambiguously the right thing to do, but in some quarters for some reason it's controversial. So I'm always glad to find another authority to say, a buyback is a dividend, a dividend is a buyback, the end.
Another way to see these two points is to think about so-called dividend recapitalizations. These are when a private equity firm, having taken control of a business, has it issue new debt in order to fund a special dividend payment to themselves. (It's the private equity firm that's being recapitalized here, not the hapless target firm.) The idea of private equity is that the acquired firm will be resold at a premium because of the productive efficiencies brought about by new management. The more or less acknowledged point of a dividend recap is to allow the private equity partners to get their money back even when they have failed to deliver the improvements, and the firm cannot be sold at a price that would allow them to recoup their investment. Dividend recaps are a small though not trivial part of the flow of payments from productive enterprises to money-owners, in recent years totaling between 5 and 10 percent of total dividends. For present purposes, there are two especially noteworthy things about them. First, they are pure value extraction, but they take the form of a dividend rather than a share repurchase. This suggests that if the SEC were to crack down on buybacks, as people Lazonick suggest, it would be easy for special dividends to take their place. Second, they take place at closely held firms, where the managers have been personally chosen by the new owners. It's the partners at Cerberus or Apollo who want the dividends, not their hired guns in the CEO suites. It's an interesting question why the partners want to squeeze these immediate cash payments out of their prey when, you would think, they would just reduce the sale price of the carcass dollar for dollar. But the important point is that here we have a case where there's no entrenched management, no coordination problems among shareholders -- and Lazonick's "downsize-and-distribute" approach to corporate finance is more pronounced than ever.
Back to the OECD report. The chapter has some useful descriptive material, comparing shareholder payouts in different countries.
[In the United States,] dividends and buybacks are running at a truly remarkable pace, even greater than capital expenditure itself in recent years. There has been plenty of scope to increase capital spending, but instead firms appear to be adjusting to the demands of investors for greater yield (dividends and buybacks). … [In Europe] dividends and buybacks are only half what United States companies pay … While there is no marked tendency for this component to rise in the aggregate in Europe, companies in the United Kingdom and Switzerland … do indeed look very similar to the United States, with very strong growth in buybacks. … [In Japan] dividends and buybacks are minuscule compared with companies in other countries. …Here, for the US, are shareholder payouts (gray), investment (dark blue), and new borrowing (light blue, with negative values indicating an increase in debt; ignore the dotted "net borrowing" line), all given as a percent of total sales. We are interested in the lower panel.

As you can see, investment is quite stable as a fraction of sales. Shareholder payouts, by contrast, dropped sharply over 2007-2009, and have since recovered even more strongly. Since 2009, US corporations have increased their borrowing ("other financing") by about 4 percent of sales; shareholder payouts have increased by an almost exactly equal amount. This is consistent with my argument that in the shareholder-dominated corporation, real activity is largely buffered from changes in financial conditions. Shifts in the availability of credit simply result in larger or smaller payments to shareholders. The OECD report takes a similar view, that access to credit is not an important factor in variation in corporate investment spending.
The bottom line, though the OECD report doesn't quite put it this way, is that wealth-owners strongly prefer claims on future income that take money-like forms over claims on future incomes exercised through concrete productive activity. [1] This is, again, simply Keynes' liquidity premium, which the OECD authors knowing or unknowingly (but without crediting him) summarize well:
It was noted earlier that capital expenditures appear to have a higher hurdle rate than for financial investors. There are two fundamental reasons for this. First, real investors have a longer time frame compared to financial investors who believe (perhaps wrongly at times) that their positions can be quickly unwound.From a social standpoint, therefore, it matters how much authority is exercised by wealth-owners, who embody the "M" moment of capital, and how much is exercised by the managers or productive capitalists (the OECD's "real investors") who embody its "P" moment. [2] Insofar as the former dominate, fixed investment will be discouraged, especially when its returns are further off or less certain.
Second, managers … operate in a very uncertain world and the empirical evidence … suggests that equity investors punish companies that invest too much and reward those that return cash to investors. If managers make an error of judgement they will be punished by activist investors and/or stock market reactions … hence they prefer buybacks.Finally, it's interesting what the OECD says about claims that high payouts are simply a way for financial markets to reallocate investment spending in more productive directions.
It is arguable that if managers do not have profitable projects, it makes sense to give the money back to investors so that they can reallocate it to those with better ideas. However, the evidence … suggests that the buyback phenomenon is not associated with rising productivity and better returns on equity.Of course this isn't surprising. It's consistent with the academic literature on shareholder activism, and on the earlier takeover wave, which finds success at increasing payments to shareholders but not at increasing earnings or productive efficiency. For example, this recent study concludes:
We did not see evidence that targets’ financials improved... The targets’ leverage and payout, however, did seem to increase, suggesting that the activists are unlocking value by prompting management to return additional cash to shareholders.Still, it's noteworthy to see a bastion of orthodoxy like the OECD flatly stating that shareholder activism is pure extraction and does nothing for productivity.
UPDATE: Here's James Mackintosh discussing this same material on "The Short View":
[1] It's worth mentioning here this interesting recent Australian survey of corporate executives, which found that new investment projects are judged by a minimum expected return or hurdle rate that is quite high -- usually in excess of 10 percent -- and not unresponsive to changes in interest rates. Even more interesting for our purposes, many firms report that they evaluate projects not based on a rate of return but on a payback period, often as short as three years.
[2] The language of "M and "P" moments is of course taken from Marx's vision of capital as a process of transformation, from money to commodities to authority over a production process, back to commodities and finally back to money. In Capital Vol. 1 and much of his other writing, Marx speaks of the capitalist as straightforwardly the embodiment of capital, a reasonable simplification given his focus there and the fact that in the 1860s absentee ownership was a rare exception. There is a much more complex discussion of the ways in which the different moments of capital can take the form of distinct and possibly conflicting social actors in Capital Vol. 3, Part 5, especially chapter 27.
Monday, June 8, 2015
The Myth of Reagan's Debt
[Cross-posted from the new blog at jwmason.org.]
Arjun and I have been working lately on a paper on monetary and fiscal policy. (You can find the current version here.) The idea, which began with some posts on my blog last year, is that you have to think of the output gap and the change in the debt-GDP ratio as jointly determined by the fiscal balance and the policy interest rate. It makes no sense to talk about the "natural" (i.e. full-employment) rate of interest, or "sustainable" (i.e. constant debt ratio) levels of government spending and taxes. Both outcomes depend equally on both policy instruments. This helps, I think, to clarify some of the debates between orthodoxy and proponents of functional finance. Functional finance and sound finance aren't different theories about how the economy works, they're different preferred instrument assignments.
We started working on the paper with the idea of clarifying these issues in a general way. But it turns out that this framework is also useful for thinking about macroeconomic history. One interesting thing I discovered working on it is that, despite what we all think we know, the increase in federal borrowing during the 1980s was mostly due to higher interest rate, not tax and spending decisions. Add to the Volcker rate hikes the deep recession of the early 1980s and the disinflation later in the decade, and you've explained the entire rise in the debt-GDP ratio under Reagan. What's funny is that this is a straightforward matter of historical fact and yet nobody seems to be aware of it.
Here, first, are the overall and primary budget balances for the federal government since 1960. The primary budget balance is simply the balance excluding interest payments -- that is, current revenue minus . non-interest expenditure. The balances are shown in percent of GDP, with surpluses as positive values and deficits as negative. The vertical black lines are drawn at calendar years 1981 and 1990, marking the last pre-Reagan and first post-Reagan budgets.
The black line shows the familiar story. The federal government ran small budget deficits through the 1960s and 1970s, averaging a bit more than 0.5 percent of GDP. Then during the 1980s the deficits ballooned, to close to 5 percent of GDP during Reagan's eight years -- comparable to the highest value ever reached in the previous decades. After a brief period of renewed deficits under Bush in the early 1990s, the budget moved to surplus under Clinton in the later 1990s, back to moderate deficits under George W. Bush in the 2000s, and then to very large deficits in the Great Recession.
The red line, showing the primary deficit, mostly behaves similarly to the black one -- but not in the 1980s. True, the primary balance shows a large deficit in 1984, but there is no sustained movement toward deficit. While the overall deficit was about 4.5 points higher under Reagan compared with the average of the 1960s and 1970s, the primary deficit was only 1.4 points higher. So over two-thirds of the increase in deficits was higher interest spending. For that, we can blame Paul Volcker (a Carter appointee), not Ronald Reagan.
Volcker's interest rate hikes were, of course, justified by the need to reduce inflation, which was eventually achieved. Without debating the legitimacy of this as a policy goal, it's important to keep in mind that lower inflation (plus the reduced growth that brings it about) mechanically raises the debt-GDP ratio, by reducing its denominator. The federal debt ratio rose faster in the 1980s than in the 1970s, in part, because inflation was no longer eroding it to the same extent.
To see the relative importance of higher interest rates, slower inflation and growth, and tax and spending decisions, the next figure presents three counterfactual debt-GDP trajectories, along with the actual historical trajectory. In the first counterfactual, shown in blue, we assume that nominal interest rates were fixed at their 1961-1981 average level. In the second counterfactual, in green, we assume that nominal GDP growth was fixed at its 1961-1981 average. And in the third, red, we assume both are fixed. In all three scenarios, current taxes and spending (the primary balance) follow their actual historical path.
In the real world, the debt ratio rose from 24.5 percent in the last pre-Reagan year to 39 percent in the first post-Reagan year. In counterfactual 1, with nominal interest rates held constant, the increase is from 24.5 percent to 28 percent. So again, the large majority of the Reagan-era increase in the debt-GDP ratio is the result of higher interest rates. In counterfactual 2, with nominal growth held constant, the increase is to 34.5 percent -- closer to the historical level (inflation was still quite high in the early '80s) but still noticeably less. In counterfactual 3, with interest rates, inflation and real growth rates fixed at their 1960s-1970s average, federal debt at the end of the Reagan era is 24.5 percent -- exactly the same as when he entered office. High interest rates and disinflation explain the entire increase in the federal debt-GDP ratio in the 1980s; military spending and tax cuts played no role.
After 1989, the counterfactual trajectories continue to drift downward relative to the actual one. Interest on federal debt has been somewhat higher, and nominal growth rates somewhat lower, than in the 1960s and 1970s. Indeed, the tax and spending policies actually followed would have resulted in the complete elimination of the federal debt by 2001 if the previous i < g regime had persisted. But after the 1980s, the medium-term changes in the debt ratio were largely driven by shifts in the primary balance. Only in the 1980s was a large change in the debt ratio driven entirely by changes in interest and nominal growth rates.
So why do we care? (A question you should always ask.) Three reasons.
First, the facts themselves are interesting. If something everyone thinks they know -- Reagan's budgets blew up the federal debt in the 1980s -- turns out not be true, it's worth pointing out. Especially if you thought you knew it too.
Second is a theoretical concern which may not seem urgent to most readers of this blog but is very important to me. The particular flybottle I want to find the way out of is the idea that money is neutral, veil -- that monetary quantities are necessarily, or anyway in practice, just reflections of "real" quantities, of the production, exchange and consumption of tangible goods and services. I am convinced that to understand our monetary production economy, we have to first understand the system of money incomes and payments, of assets and liabilities, as logically self-contained. Only then we can see how that system articulates with the concrete activity of social production. [1] This is a perfect example of why this "money view" is necessary. It's tempting, it's natural, to think of a money value like the federal debt in terms of the "real" activities of the federal government, spending and taxing; but it just doesn't fit the facts.
Third, and perhaps most urgent: If high interest rates and disinflation drove the rise in the federal debt ratio in the 1980s, it could happen again. In the current debates about when the Fed will achieve liftoff, one of the arguments for higher rates is the danger that low rates lead to excessive debt growth. It's important to understand that, historically, the relationship is just the opposite. By increasing the debt service burden of existing debt (and perhaps also by decreasing nominal incomes), high interest rates have been among the main drivers of rising debt, both public and private. A concern about rising debt burdens is an argument for hiking later, not sooner. People like Dean Baker and Jamie Galbraith have pointed out -- correctly -- that projections of rising federal debt in the future hinge critically on projections of rising interest rates. But they haven't, as far as I know, said that it's not just hypothetical. There's a precedent.
[1] Or in other words, I want to pick up from the closing sentence of Doug Henwood's Wall Street, which describes the book as part of "a project aiming to end the rule of money, whose tyranny is sometimes a little hard to see." We can't end the rule of money until we see it, and we can't see it until we understand it as something distinct from productive activity or social life in general.
 |
| ... or at least don't blame him for increased federal debt. |
Arjun and I have been working lately on a paper on monetary and fiscal policy. (You can find the current version here.) The idea, which began with some posts on my blog last year, is that you have to think of the output gap and the change in the debt-GDP ratio as jointly determined by the fiscal balance and the policy interest rate. It makes no sense to talk about the "natural" (i.e. full-employment) rate of interest, or "sustainable" (i.e. constant debt ratio) levels of government spending and taxes. Both outcomes depend equally on both policy instruments. This helps, I think, to clarify some of the debates between orthodoxy and proponents of functional finance. Functional finance and sound finance aren't different theories about how the economy works, they're different preferred instrument assignments.
We started working on the paper with the idea of clarifying these issues in a general way. But it turns out that this framework is also useful for thinking about macroeconomic history. One interesting thing I discovered working on it is that, despite what we all think we know, the increase in federal borrowing during the 1980s was mostly due to higher interest rate, not tax and spending decisions. Add to the Volcker rate hikes the deep recession of the early 1980s and the disinflation later in the decade, and you've explained the entire rise in the debt-GDP ratio under Reagan. What's funny is that this is a straightforward matter of historical fact and yet nobody seems to be aware of it.
Here, first, are the overall and primary budget balances for the federal government since 1960. The primary budget balance is simply the balance excluding interest payments -- that is, current revenue minus . non-interest expenditure. The balances are shown in percent of GDP, with surpluses as positive values and deficits as negative. The vertical black lines are drawn at calendar years 1981 and 1990, marking the last pre-Reagan and first post-Reagan budgets.
The black line shows the familiar story. The federal government ran small budget deficits through the 1960s and 1970s, averaging a bit more than 0.5 percent of GDP. Then during the 1980s the deficits ballooned, to close to 5 percent of GDP during Reagan's eight years -- comparable to the highest value ever reached in the previous decades. After a brief period of renewed deficits under Bush in the early 1990s, the budget moved to surplus under Clinton in the later 1990s, back to moderate deficits under George W. Bush in the 2000s, and then to very large deficits in the Great Recession.
The red line, showing the primary deficit, mostly behaves similarly to the black one -- but not in the 1980s. True, the primary balance shows a large deficit in 1984, but there is no sustained movement toward deficit. While the overall deficit was about 4.5 points higher under Reagan compared with the average of the 1960s and 1970s, the primary deficit was only 1.4 points higher. So over two-thirds of the increase in deficits was higher interest spending. For that, we can blame Paul Volcker (a Carter appointee), not Ronald Reagan.
Volcker's interest rate hikes were, of course, justified by the need to reduce inflation, which was eventually achieved. Without debating the legitimacy of this as a policy goal, it's important to keep in mind that lower inflation (plus the reduced growth that brings it about) mechanically raises the debt-GDP ratio, by reducing its denominator. The federal debt ratio rose faster in the 1980s than in the 1970s, in part, because inflation was no longer eroding it to the same extent.
To see the relative importance of higher interest rates, slower inflation and growth, and tax and spending decisions, the next figure presents three counterfactual debt-GDP trajectories, along with the actual historical trajectory. In the first counterfactual, shown in blue, we assume that nominal interest rates were fixed at their 1961-1981 average level. In the second counterfactual, in green, we assume that nominal GDP growth was fixed at its 1961-1981 average. And in the third, red, we assume both are fixed. In all three scenarios, current taxes and spending (the primary balance) follow their actual historical path.
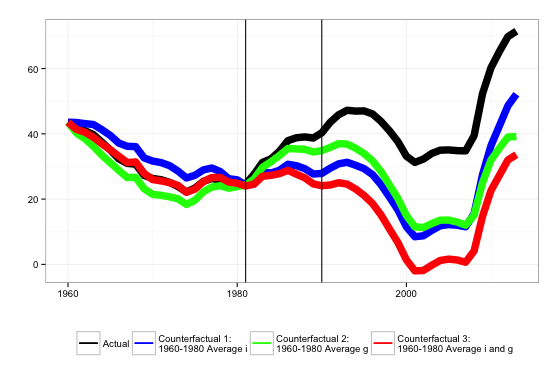
In the real world, the debt ratio rose from 24.5 percent in the last pre-Reagan year to 39 percent in the first post-Reagan year. In counterfactual 1, with nominal interest rates held constant, the increase is from 24.5 percent to 28 percent. So again, the large majority of the Reagan-era increase in the debt-GDP ratio is the result of higher interest rates. In counterfactual 2, with nominal growth held constant, the increase is to 34.5 percent -- closer to the historical level (inflation was still quite high in the early '80s) but still noticeably less. In counterfactual 3, with interest rates, inflation and real growth rates fixed at their 1960s-1970s average, federal debt at the end of the Reagan era is 24.5 percent -- exactly the same as when he entered office. High interest rates and disinflation explain the entire increase in the federal debt-GDP ratio in the 1980s; military spending and tax cuts played no role.
After 1989, the counterfactual trajectories continue to drift downward relative to the actual one. Interest on federal debt has been somewhat higher, and nominal growth rates somewhat lower, than in the 1960s and 1970s. Indeed, the tax and spending policies actually followed would have resulted in the complete elimination of the federal debt by 2001 if the previous i < g regime had persisted. But after the 1980s, the medium-term changes in the debt ratio were largely driven by shifts in the primary balance. Only in the 1980s was a large change in the debt ratio driven entirely by changes in interest and nominal growth rates.
So why do we care? (A question you should always ask.) Three reasons.
First, the facts themselves are interesting. If something everyone thinks they know -- Reagan's budgets blew up the federal debt in the 1980s -- turns out not be true, it's worth pointing out. Especially if you thought you knew it too.
Second is a theoretical concern which may not seem urgent to most readers of this blog but is very important to me. The particular flybottle I want to find the way out of is the idea that money is neutral, veil -- that monetary quantities are necessarily, or anyway in practice, just reflections of "real" quantities, of the production, exchange and consumption of tangible goods and services. I am convinced that to understand our monetary production economy, we have to first understand the system of money incomes and payments, of assets and liabilities, as logically self-contained. Only then we can see how that system articulates with the concrete activity of social production. [1] This is a perfect example of why this "money view" is necessary. It's tempting, it's natural, to think of a money value like the federal debt in terms of the "real" activities of the federal government, spending and taxing; but it just doesn't fit the facts.
Third, and perhaps most urgent: If high interest rates and disinflation drove the rise in the federal debt ratio in the 1980s, it could happen again. In the current debates about when the Fed will achieve liftoff, one of the arguments for higher rates is the danger that low rates lead to excessive debt growth. It's important to understand that, historically, the relationship is just the opposite. By increasing the debt service burden of existing debt (and perhaps also by decreasing nominal incomes), high interest rates have been among the main drivers of rising debt, both public and private. A concern about rising debt burdens is an argument for hiking later, not sooner. People like Dean Baker and Jamie Galbraith have pointed out -- correctly -- that projections of rising federal debt in the future hinge critically on projections of rising interest rates. But they haven't, as far as I know, said that it's not just hypothetical. There's a precedent.
[1] Or in other words, I want to pick up from the closing sentence of Doug Henwood's Wall Street, which describes the book as part of "a project aiming to end the rule of money, whose tyranny is sometimes a little hard to see." We can't end the rule of money until we see it, and we can't see it until we understand it as something distinct from productive activity or social life in general.
Wednesday, June 3, 2015
The End of the Supermanager?
[I am transitioning my blog over to my new site, but for now I will continue to crosspost stuff here.]
Everyone is talking about this new paper, Firming Up Inequality. It uses individual-level data from the Social Security Administration, matched to employers by Employer Identification Number (EIN), to decompose changes in earnings inequality into a within-firm and a between-firm component. It's a great exercise -- marred only modestly by the fact that the proprietary data means that no one can replicate it -- exactly the sort of careful descriptive work I wish more economists would do.
The big finding from the paper is that all the rise in earnings inequality between 1982 and 2012 is captured by the between-firm component. There is no increase in the earnings of a person in the top 1% of the earnings distribution within a given business, and the earnings of someone at the median for that same business. The whole increase in earnings inequality over this period consists of a widening gap between the firms that pay more across the board, and the firms that pay less.
I'm not sure we want to take the results of this study at face value. Yes, we should be especially interested in empirical work that challenges our prior beliefs, but at the same time, it's hard to square the claims here with all the other evidence of a disproportionate increase in the top pay within a given firm. Lawrence Mishel gives some good reasons for skepticism here. The fact that the whole increase is accounted for by the between-firm component, yet none by the between-industry component, is very puzzling. More generally, I wonder how reliable is the assumption that there is a one to one match between EINs and what we normally think of as employers.
That said, these findings may be pointing to something important. As a check on the plausibility of the numbers in the paper, I took a look at labor income of the top 1 percent and 0.01 percent of US households, as reported in the World Top Incomes Database. And I found something I didn't expect: Since 2000, there's been a sharp fall in the share of top incomes that come from wages and salaries. In 2000, according to the tax data used by Piketty and his collaborators, households in the top 0.01 percent got 61 percent of their income from wages, salaries and pensions. By 2013, that had fallen to just 33 percent. (That's excluding capital gains; including them, the labor share of top incomes fell from 31 percent to 21 percent.) For the top 1 percent, the labor share falls from 63 percent to 56 percent, the lowest it's been since the 1970s.
Here is the average income of the top 0.01 percent over the past 40 years in inflation-adjusted dollars, broken into three components: labor income, all other non-capital gains income, and capital gains.
As you can see, the 1990s look very different from today. Between 1991 and 2000, the average labor income of a top 0.01% household rose from $2.25 million to $10 million; this was about 90 percent of the total income increase for these households. During the 1990s, rising incomes at the top really were about highly paid superstars. Since 2000, though, while average incomes of the top 0.01% have increased another 20 percent, labor income for these households has fallen by almost half, down to $5.5 million. (Labor income has also fallen for the top 1 percent, though less dramatically.) So the "Firming" results, while very interesting, are perhaps less important for the larger story of income distribution than both the authors and critics assume. The rise in income inequality since 2000 is not about earnings; the top of the distribution is no longer the working rich. I don't think that debates about inequality have caught up with this fact.
Fifteen years ago, the representative rich person in the US was plausibly a CEO, or even an elite professional. Today, they mostly just own stuff.
Everyone is talking about this new paper, Firming Up Inequality. It uses individual-level data from the Social Security Administration, matched to employers by Employer Identification Number (EIN), to decompose changes in earnings inequality into a within-firm and a between-firm component. It's a great exercise -- marred only modestly by the fact that the proprietary data means that no one can replicate it -- exactly the sort of careful descriptive work I wish more economists would do.
The big finding from the paper is that all the rise in earnings inequality between 1982 and 2012 is captured by the between-firm component. There is no increase in the earnings of a person in the top 1% of the earnings distribution within a given business, and the earnings of someone at the median for that same business. The whole increase in earnings inequality over this period consists of a widening gap between the firms that pay more across the board, and the firms that pay less.
I'm not sure we want to take the results of this study at face value. Yes, we should be especially interested in empirical work that challenges our prior beliefs, but at the same time, it's hard to square the claims here with all the other evidence of a disproportionate increase in the top pay within a given firm. Lawrence Mishel gives some good reasons for skepticism here. The fact that the whole increase is accounted for by the between-firm component, yet none by the between-industry component, is very puzzling. More generally, I wonder how reliable is the assumption that there is a one to one match between EINs and what we normally think of as employers.
That said, these findings may be pointing to something important. As a check on the plausibility of the numbers in the paper, I took a look at labor income of the top 1 percent and 0.01 percent of US households, as reported in the World Top Incomes Database. And I found something I didn't expect: Since 2000, there's been a sharp fall in the share of top incomes that come from wages and salaries. In 2000, according to the tax data used by Piketty and his collaborators, households in the top 0.01 percent got 61 percent of their income from wages, salaries and pensions. By 2013, that had fallen to just 33 percent. (That's excluding capital gains; including them, the labor share of top incomes fell from 31 percent to 21 percent.) For the top 1 percent, the labor share falls from 63 percent to 56 percent, the lowest it's been since the 1970s.
Here is the average income of the top 0.01 percent over the past 40 years in inflation-adjusted dollars, broken into three components: labor income, all other non-capital gains income, and capital gains.
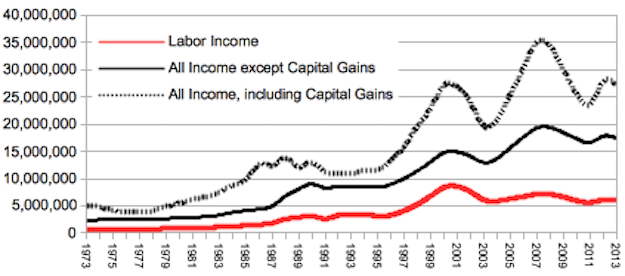 |
| Average income of top 0.01% of US households, from World Top Incomes Database. 3-year moving averages. |
As you can see, the 1990s look very different from today. Between 1991 and 2000, the average labor income of a top 0.01% household rose from $2.25 million to $10 million; this was about 90 percent of the total income increase for these households. During the 1990s, rising incomes at the top really were about highly paid superstars. Since 2000, though, while average incomes of the top 0.01% have increased another 20 percent, labor income for these households has fallen by almost half, down to $5.5 million. (Labor income has also fallen for the top 1 percent, though less dramatically.) So the "Firming" results, while very interesting, are perhaps less important for the larger story of income distribution than both the authors and critics assume. The rise in income inequality since 2000 is not about earnings; the top of the distribution is no longer the working rich. I don't think that debates about inequality have caught up with this fact.
Fifteen years ago, the representative rich person in the US was plausibly a CEO, or even an elite professional. Today, they mostly just own stuff.
Thursday, May 28, 2015
Touchez pas au Grisbe
Regular blogging will resume shortly. In the meantime, here is a clip of me on tv.
Let me make a few observations:
1. If you are going to do something like this, you need to have one simple point you want to make, and make it repeatedly, as many chance as you get. And you should rehearse. Watch the show, see if you are likely to get 30 seconds, or 60, or 90, and practice a rap that takes just that time. If you are going to go on tv, you probably know this already, but maybe not.
2. It's true about McDonald's. $5.5 billion profits, $6.5 billion in payouts to shareholders. I talked in the show, for obvious reasons, about ordinary workers, but it may be perfectly rational for McDonald's to stomp on the faces of its workers. I think the people who are being screwed over specifically by the current smash-and-grab strategy are franchise owners. Interesting fact (via Math Babe), to buy a McDonald's franchise you have to put up $250,000 of your own money, no borrowed funds allowed.
3. It's easy to mock the food -- I wouldn't eat it, except maybe the fries -- but don't forget, in a lot of neighborhoods McDonald's is the public space. Remember those Korean guys who were suing for the right to just sit there? I remember something similar from the South Side of Chicago in the '90s. If you wanted to meet someone in public, McDonald's was the place.
4. It's a pity that the clip here cuts off before the end of the segment, when I had another chance to speak. In the part you don't see, I said again that workers at McDonald's were demanding higher wages, and said again that it would be sensible to pay them more if only shareholders were not in the saddle. This prompted the producer to put the clip of protesting workers up, which may be more valuable than anything I actually said.
5. That guy, "Don't touch my dividends!" What an asshole, right? That was my big missed opportunity to jump back in. I should have said "YOU are the problem. You want this company to become successful, but you don't want to give up a dollar to make that happen."
6. I think the tie I'm wearing belongs to my friend Ben. I think he lent it to me for a court appearance some years ago, and I never gave it back.
7. Last piece of advice. If you're at all like me, the only reason you are on tv is because you are part of a team, part of a movement. So, try to be useful.
Monday, April 20, 2015
Default ≠ Drachma
I've been saying for a while that people should stop assuming that a Greek default implies leaving the euro for a new currency. Much of the media coverage of the negotiations continues to assume that the two are inseparable -- that, in effect, the negotiations are over Greece remaining in the euro system. But there is no logical necessity for a default to be followed by the creation of a new currency; indeed it's hard to see any reason why the former should lead to the latter.
Finally the consensus that default must mean exit seems to be breaking down. Here's John Cochrane:
And now in today's FT, Wolfgang Munchau writes:
Finally the consensus that default must mean exit seems to be breaking down. Here's John Cochrane:
Please can we stop passing along this canard -- that Greece defaulting on some of its bonds means that Greece must must change currencies. Greece no more needs to leave the euro zone than it needs to leave the meter zone and recalibrate all its rulers, or than it needs to leave the UTC+2 zone and reset all its clocks to Athens time. When large companies default, they do not need to leave the dollar zone. When cities and even US states default they do not need to leave the dollar zone.Cochrane's political views are one thing, but he is a very smart guy. And in this case, I think the Walrasian view of money as numéraire is helpful. It's important to remember that euros are not physical things, they are simply units in which contractual commitments are denominated.
And now in today's FT, Wolfgang Munchau writes:
The big question — whether Greece will leave the eurozone or not — remains unanswerable. But I am now fairly certain it will default. My understanding is that some eurozone officials are at least contemplating the possibility of a Greek default but without Grexit. ...
On whom could, or should, Greece default? It could default on its citizens by not paying public-sector wages or pensions. That would be morally repugnant and politically suicidal... it could default on the two loans it received from its EU partners, though it is not due to start repaying those until 2020... Defaulting on the IMF and ECB is the only option that would bring genuine financial relief in the short term. ...
Default is not synonymous with exit. There is no EU ruling that says you have to leave the eurozone when you default on your debt. The link between default and exit is indirect; if a country defaults, its defaulting securities are no longer eligible as IOUs for the country’s banks to tender at ECB money auctions....
So to default “inside the eurozone” one only needs to devise another way to keep the banking system afloat. If someone could concoct a brilliant answer, there would be no need for Grexit.
... The economic case for a debt default is overwhelming. ... Full servicing would require huge primary surpluses — that is, surpluses before payment of interest on debt. It would leave Greece trapped in a debt depression for a long time. The scheduled primary surplus for 2016 is 4.5 per cent, which is bordering on the insane. Athens absolutely needs to default. At the same time, there is a strong case for remaining in the eurozone.
This hits all the key points. First, there is no logical connection between defaulting and creating a new currency. (Probably better to use that wording, rather than "exit.") Second, default would open up significant space in Greece's fiscal position, and would not hurt the its external position. This follows from the fact that Greece currently has a substantial primary surplus and a slight positive trade balance. [1] Third, the only reason there is any link is that default might cause the ECB to cease accepting new liabilities from Greek banks, and it might be hard for the Bank of Greece and/or Greek government to take the ECB's place under the existing rules of the eurosystem. So, fourth, the real problem with default is the need to ensure that the Greek payments system continues to operate even if the ECB tries to sabotage it.
The phrasing of that last point might seem hyperbolic. But imagine if, during the Detroit bankruptcy negotiations, the Fed had announced that if the city did not pay off its creditors in full, the Fed would use all its regulatory tools to shut down any banks operating in the city. That's a close analogy to the situation in Europe.
Maintaining interbank payments within Greece does not necessarily require the Greek government to issue any new liabilities. And it certainly doesn't require that Greek bank accounts be redenominated. All that is necessary is that if someone with a deposit in Greek bank A wants to make a payment to someone with an account at Greek bank B, there is some system by which bank A can transfer a settlement asset to bank B, acquiring the asset if necessary by issuing a new liability. The technical aspect of this is not challenging, and even the practical aspect, since the Bank of Greece already performs exactly this function. As far as I can tell, the only problem is a political one -- given that the Bank of Greece is run by holdovers from the former Greek government, it's possible that if the ECB told them to stop facilitating payments between Greek banks they would listen, even if the Greek government said to carry on.
Now some people will say, "oh but the Treaties! oh but the Bank of Greece isn't allowed to accept the liabilities of Greek banks if Brussels says no! oh but the ELA rules!" [2] Obviously I think this is silly. In the first place, the "rules" are hopelessly vague, so if the ECB's does shut off liquidity to Greek banks in the event of a default, that will be a political choice. And on the other side, Greece is a sovereign nation. It may have delegated decisionmaking at the Bank of Greece to the ECB, but that also was a political choice, which can be reversed. More to the point, the rules definitely don't allow for exit. Nor for that matter do they allow for default -- and as Munchau correctly points out, cuts to the salaries and pensions of public employees are also a form of default. Rules are going to be broken, whether Greece creates a new currency or not. And it is not at all clear to me that the demands on the Greek state from recreating the drachma, are any less than the demands from maintaining payments between Greek banks in the absence of ECB support -- which is all it takes to default and continue using the euro. If anything, the former seems strictly more demanding than the latter, since Greece will need its own central bank either way.
This all may seem pedantic, but it is important: The threat of ejection from the euro is one of the most powerful weapons the creditors have. And let's remember, the only direct consequence of a breakdown in negotiations, is a default on Greek government debt.
Now there is another argument, which is that exit is positively desirable since a flexible currency would allow Greece to reliably achieve current account balance even once income growth resumes. I think that is wrong -- but that's a topic for another post. (I discussed the issue a couple years ago here.) But even if, unlike me, you think that a flexible exchange rate would be helpful for Greece, it doesn't follow that that decision is bound up with the debt negotiations.
[1] It is possible that the apparent primary surplus is due to manipulation of the budget numbers by the previous government. I think that the arguments here would still apply if there were really a primary deficit, but it would complicate things.
[2] Or, "oh but that would be ungrateful." In one of its more disingenuous editorials I can recall, the FT last month wept crocodile tears over the fact that "default on Greek debts would deter wealthier voters from ever again helping their neighbours in financial distress." Apparently German banks didn't care about the interest on all the Greek government bonds they bought; they only lent so long out of kindness, I suppose. Also, it doesn't seem to have occurred to the editorialists that deterring the financing of large current account deficits might be a good thing.
UPDATE: This seems important:
UPDATE 2: Martin Wolf is on board as well. (Though he doesn't like my Detroit analogy.)
UPDATE: This seems important:
A country that defaults would not have to leave the euro, the European Central Bank's vice president said on Monday...
Vitor Constancio discussed the possibility of a debt default and controls on the movement of money, saying neither necessarily meant a departure from the currency bloc. "If a default will happen ... the legislation does not allow that a country that has a default ... can be expelled from the euro," he told the European Parliament...
Constancio also touched on the possibility of capital controls. "Capital controls can only be introduced if the Greek government requests," he said, adding that they should be temporary and exceptional. "As you saw in the case of Cyprus, capital controls did not imply getting out of the euro." ...
"We are convinced at the ECB that there will be no Greek exit," he said. "The (European Union) treaty does not foresee that a country can be formally, legally expelled from the euro. We think it should not happen." ...
"If the state defaults, that has no automatic implications regarding the banks, if the banks have not defaulted, if the banks are solvent and if the banks have collateral that is accepted," Constancio said.Maybe they were worried that Greece would call their bluff. Or who knows, maybe the culture of the place has changed under Draghi and they are no longer ready to serve as austerity's battering ram. In any case, it's hard to see this as anything but a big step back by the ECB.
UPDATE 2: Martin Wolf is on board as well. (Though he doesn't like my Detroit analogy.)
Sunday, April 19, 2015
The IMF on Investment since 2008
Vox today has a useful piece by five IMF economists on the behavior of business investment during and since the Great Recession. [1] From my point of view, there are three important points here.
1. The most important difference between this cycle and previous ones is the larger fall and slower recovery of private investment. This has always been my view, and I think it's an especially important point for heterodox folks to take on board because there has been such (excessive, in my opinion) emphasis on the inequality-consumption link in explaining persistent demand weakness.
This relationship between output and investment is consistent with previous recessions:
business investment has deviated little from what could be expected given the weakness in economic activity. In other words, firms have reacted to weak sales – both current and prospective – by reducing capital spending. Indeed, in surveys, businesses typically report lack of customer demand as the dominant challenge they face.
In other words, the old Keynesian "accelerator" story explains the bulk of the shortfall in investment since 2008.
2. Historically, deviations in output and investment has been persistent; there is no tendency for recessions to be followed by a return to the previous trend.
 |
| The blue line shows the behavior of output and investment in recessions historically, relative to the pre-recession trend. Note that is no tendency for the gap to close, as much as six years after the previous peak. |
The authors don't emphasize this point, but it is important. If we look at recessions across a range of industrialized countries, on average the output losses are permanent. There is no tendency for output to return to the pre-trend. If this is true, there's no basis for the conventional distinction between a demand-determined "short run" and a supply-determined "long run." There is just one dynamic process. Steve Fazzari has reached this same conclusion, as I've written about here. Roger Farmer has just posted an econometric demonstration that in the postwar US, output changes are persistent -- there is no tendency to return to a trend.
3. There's no reason to think that the investment deficit is explained by financial constraints. I should say frankly that the paper didn't move my priors much at all on this point, but it's still interesting that that's what it says. By their estimates, firms in more "financially-dependent" sectors (this is a standard technique, but whatever) initially reduced investment more than firms in less financially-dependent sectors, but as of 2013 investment in both groups of firms were the same 40 percent below the pre-crisis trend. If you believe these results -- and again, I don't put much weight on them, except as an indicator of the IMF flavor of received opinion -- then while tighter credit may have helped trigger the crisis, it cannot explain the persistent weakness of demand. Or from a policy perspective -- and the authors do say this -- measures to improve access to credit are unlikely to achieve much, at least relative to measures to boost demand.
 |
| Investment by sector |
So these are features it might be nice to incorporate into a macro model -- investment determined mainly by (changes in) current output; a single system of demand-based dynamics, as opposed to a short-run demand story and a long-run supply-based steady state growth path; a possibility of multiple equilibria, such that (let's say) a temporary interruption of credit flows can produce a persistent reduction in output. On one level I don't especially trust these results. But on another level, I think they provide a good set of stylized facts that macro models should aspire to parsimoniously explain.
[1] The European Vox, not the Klein-Yglesias one.
UPDATE: Krugman today points to the same work and also interprets it as support for an accelerator story.
UPDATE: Krugman today points to the same work and also interprets it as support for an accelerator story.
Thursday, April 16, 2015
New-Old Paper on the Balance of Payments
Four or five years ago, I wrote a paper arguing that the US current account deficit, far from being a cause of the crisis of 2008, was a stabilizing force in the world economy. I presented it at a conference and then set it aside. I recently reread it and I think the arguments hold up well. If anything the case that the US, as the center of the world financial system, ought to run large current account deficits indefinitely looks even stronger now, given the contrasting example of Germany's behavior in the European system.
I've put the paper up as a working paper at John Jay economics department site. Here's the abstract:
I've put the paper up as a working paper at John Jay economics department site. Here's the abstract:
Persistent current account imbalances need not contribute to macroe- conomic instability, despite widespread claims to the contrary by both mainstream and Post Keynesian economists. On the contrary, in a world of large capital inflows, a high and stable level of world output is most likely when the countries with the least capacity to generate capital inflows normally run current account surpluses, while the countries with the greatest capacity to generate capital inflows (the US in particular) normally run current account deficits. An emphasis on varying balance of payments constraints is consistent with the larger Post Keynesian vision, which emphasizes money flows and claims are not simply passive reflections of “real” economic developments, but exercise an important influence in their own right. It is also consistent with Keynes’ own views. This perspective helps explain why the crisis of 2008 did not take the form of a fall in the dollar, and why reserve accumulation in East Asia successfully protected those countries from a repeat of the crisis of 1997. Given the weakness of the “automatic” mechanisms that are supposed to balance trade, income and financial flows, a reduction of the US current account deficit is likely to exacerbate, rather than ameliorate, global macroeconomic instability.You can read the whole thing here.
Sunday, April 12, 2015
The Greek Crisis and Monetary Sovereignty
Note: This post only really makes sense as a continuation of the argument in this one.
It's a general rule that the internal logic of a system only becomes visible when it breaks down. A system that is smoothly reproducing itself provides no variation to show what forces it responds to. Constraints are invisible if they don't bind. You don't know where power lies until a decision is actively contested.
In that sense, the crises of the past seven years — and the responses to them — should have been very illuminating, at least if we can figure out what to learn from them. The current crisis in Greece is an ideal opportunity to learn where power is exercised in the union, and how tightly the single currency really binds national governments. Of course, we will learn more about the contours of the constraints if the Syriza government is more willing to push against them.
The particular case I'm thinking of right now is our conventional language about central banks "printing money," and the related concept of monetary sovereignty. In periods of smooth reproduction we can think of this as a convenient metaphor without worrying too much about what exactly it is a metaphor for. But if Greece refuses to accept the ECB's conditions for continued support for its banks, the question will become unavoidable.
We talk about governments "printing money" as if “money” always meant physical currency and banks were just safe-deposit boxes. Even Post Keynesian and MMT people use this language, even as they insist in the next breath that money is endogenously created by the banking system. But to understand concretely what power the ECB does or does not have over Greece, we need to take the idea of credit money seriously.
Money in modern economies means bank liabilities. [1] Bank liabilities constitute money insofar as a claim against one bank can be freely transferred to other units, and freely converted to a claim against another bank; and insofar as final settlement of claims between nonfinancial units normally takes the form of a transfer of bank liabilities.
Money is created by loan transactions, which create two pairs of balance-sheet entries — an asset for the borrowing unit and a liability for the bank (the deposit) and a liability for the borrowing unit and an asset for the bank (the loan). Money is destroyed by loan repayment, and also when the liabilities of a bank cease to be usable to settle claims between third parties. In familiar modern settings this lack of acceptability will be simultaneous with the bank being closed down by a regulatory authority, but historically things are not always so black and white. In the 19th century, it was common for a bank that ran out of reserves to suspend convertibility but continue operating. Deposits in such banks could not be withdrawn in the form of gold or equivalent, but could still be used to make payments, albeit not to all counterparties, and usually at a discount to other means of payment. [2]
To say, therefore, that a government controls the money supply or "prints money" is simply to say that it can control the pace of credit creation by banks, and that it can can maintain the acceptability of bank liabilities by third parties — which in practice means, by other banks. It follows that our conventional division of central bank functions between monetary policy proper (or setting the money supply), on the one hand, and bank regulation, operation of the interbank payments system, and lender of last resort operations, on the other, is meaningless. There is no distinct function of monetary policy, of setting the interest rate, or the money supply. "Monetary policy" simply describes one of the objectives toward which the central bank's supervisory and lender-of-last-resort functions can be exercised. It appears as a distinct function only when, over an extended period, the central bank is able to achieve its goals for macroeconomic aggregates using only a narrow subset of the regulatory tools available to it.
In short: The ability to conduct monetary policy means the ability to set the pace of new bank lending, ex ante, and to guarantee the transferability of the balances thus created, ex post.
It follows that no country with a private banking system has full monetary sovereignty. The central bank will never be able to exactly control the pace of private credit creation, and to do so even approximately except by committing regulatory tools which then are unavailable to meet other objectives. In particular, it is impossible to shift the overall yield structure without affecting yield spreads between different assets, and it is impossible to change the overall pace of credit creation without also influencing the disposition of credit between different borrowers. In a system of credit money, full monetary sovereignty requires the monetary authority to act as the monopoly lender, with banks in effect serving as just its retail outlets. [3]
Now, some capitalist economies actually approximate to this pretty closely. For example the postwar Japanese system of “window guidance” or similar systems in other Asian developmental states. [4] Something along the same lines is possible with binding reserve requirements, where the central bank has tight operational control over lending volumes. (But this requires strict limits on all kinds of credit transactions, or else financial innovation will soon bypass the requirements.) Short of this, central banks have only indirect, limited influence over the pace of money and credit creation. Such control as they do have is necessarily exercised through specific regulatory authority, and involves choices about the direction as well as the volume of lending. And it is further limited by the existence of quasi-bank substitutes that allow payments to be made outside of the formal banking system, and by capital mobility, which allows loans to be incurred, and payments made, from foreign banks.
On the other hand, a country that does not have its “own” currency still will have some tools to influence the pace of credit creation and to guarantee interbank payments, as long as there is some set of banks over which it has regulatory authority.
My conclusion is that the question of whether a country does or does not have its own currency is not a binary one, as it's almost always imagined to be. Wealth takes to form of a variety of assets, whose prospective exchange value can be more or less reliably stated in terms of some standard unit; transactions can be settled with a variety of balance-sheet changes, which interchange more or closely to par, and which are more or less responsive to the decisions of various authorities. We all know that there are some payments you can make using physical currency but not a credit or debit card, and other payments you can make with the card but not with currency. And we all know that you cannot always convert $1,000 in a bank account to exactly $1,000 in cash, or to a payment of exactly $1,000 – the various fees within the payment system means that one unit of “money” is not actually always worth one unit. [5]
In normal times, the various forms of payment used within one country are sufficiently close substitutes with each other, exchange sufficiently close to par, and are sufficiently responsive to the national monetary authority, relative to forms of payment used elsewhere, that, for most purposes, we can safely speak of a single imaginary asset “money.” But in the Greek case, it seems to me, this fiction obscures essential features of the situation. In particular, it makes the question of being “in” or “out of” the euro look like a hard binary, when, in my opinion, there are many intermediate cases and no need for a sharp transiton between them.
[1] Lance Taylor, for instance, flatly defines money as bank liabilities in his superb discussion of the history of monetary thought in Reconstructing Macroeconomics.
[2] Friedman and Schwartz discuss this in their Monetary History of the United States, and suggest that if banks had been able to suspend withdrawals when their reserves ran out, rather than closed down by the authorities, that would have been an effective buffer against against the deflationary forces of the Depression.
[3] Woodford's Interest and Prices explicitly assumes this.
[4] Window guidance is described by Richard Werner in Masters of the Yen. The importance of centralized credit allocation in Korea is discussed by the late Alice Amsden in Asia's Next Giant.
[5] Goodhart's fascinating but idiosyncratic History of Central Banking ends with a proposal for money that does not seek to maintain a constant unit value – in effect, using something like mutual fund shares for payment.
Monday, March 30, 2015
Causes and Effects of Wage Growth
Over here, a huge stack of exams, sitting ungraded since… no, I can't say, it's too embarrassing. There, a grant proposal that extensive experimentation has shown will not, in fact, write itself. And I still owe a response to all the responses and criticism to my Disgorge the Cash paper for Roosevelt. So naturally, I thought this morning would be a good time to sit down and ask what we can learn from comparing the path of labor costs in the Employment Cost Index compared with the ECEC.
The BLS explains the difference between the two measures:
Here are the two series for the full period both are available (1987-2014), both raw and adjusted for inflation ("real").

What do we learn from this?
First, the two series are closely correlated. This tells us that most of the variation in compensation is driven by changes within occupations and sectors, not by shifts in employment between occupations and sectors. This is clearly true at annual frequencies but it seems to be true over longer periods as well. For instance, let's compare the behavior of compensation in the five years since the end of the recession to the last period of strong wage growth, 1997-2004. The difference between the two periods in the average annual increase in nominal wages is almost exactly the same according to the two indexes — 2.7 points by the ECI, 2.6 points by the ECEC. In other words, slower wage growth in the recent period is entirely due to slower wages growth within particular kinds of jobs. Shifts in the composition of jobs have played no role at all.
On the face of it, the fact that almost all variation in aggregate compensation is driven by changes within employment categories, seems to favor a labor/political story of slower wage growth as opposed to a China or robots story. The most obvious versions of the latter two stories involve a disproportionate loss of high-wage jobs, whereas stories about weaker bargaining position of labor predict slower compensation growth within job categories. I wouldn't ask this one piece of evidence to carry a lot of weight in that debate. (I think it's stronger evidence against a skills-based explanation of slower wage growth.)
While the two series in general move together, the ECEC is more strongly cyclical. In other words, during periods of high unemployment and falling wages in general, there is also a shift in the composition of employment towards lower-paid occupations. And during booms, when unemployment is low and wages are rising in general, there is a shift in the direction of higher-paid job categories. [1] Insofar as wages and labor productivity are correlated, this cyclical shift between higher-wage and lower-wage sectors could help explain why employment is more stable than output. I've had the idea for a while that the Okun's law relationship -- the less than one-for-one correlation between employment and output growth -- reflects not only hiring/firing costs and overhead labor, but also shifts in the composition of employment in response to demand. In other words, in addition to employment adjustment costs at the level of individual enterprises, the Okun coefficient reflects cyclically varying degrees of "disguised unemployment" in Joan Robinson's sense. [2] This is an argument I'd like to develop properly someday, since it seems fairly obvious, potentially important and empirically tractable, and I haven't seen anyone else make it. [3] (I'm sure someone has.)
What's going on in the most recent year? Evidently, there has been no acceleration of wage growth for a given job, but the mix of jobs created has shifted toward higher-wage categories. This suggests that to the extent wages are rising faster, it's not a sign of labor-market pressures. (Some guy from Deutsche Bank interprets the same divergence as support for raising rates, which it's hard not to feel is deliberately dishonest.) As for which particular higher-wage job categories are growing more rapidly -- I don't know. And, what's going on in 1995? That year has by far the biggest divergence between the two series. It could well be an artifact of some kind, but if not, seems important. A large fall in the ECEC relative to the ECI could be a signature of deindustrialization. I'm not exploring the question further now (those exams…) but it would be interesting to ask analogous question with some series that extends earlier. It's likely that if we were looking at the 1970s-1980s, we would find a much larger share of variation in wage growth explained by compositional shifts.
Should we adjust for inflation? I give the "real" series here, but I am in general skeptical that there is any sense in which an ex post adjustment of money flows for inflation is more real than, say, The Real World on MTV. I am even more doubtful than usual in this case, because we are normally told to think that changes in nominal wages are the main determinant of inflation. Obviously in that case we have to think of the underlying labor-market process as determining a change in nominal wage. Still, if we do compute a "real" index, things look a little different. Real ECI rises 14 percent over the full 1987-2014 period, while real ECEC rises only 5 percent. So now we can say that about two-thirds of the increase in real wages within particular job categories over the past three decades, was offset by a shift in the composition of employment toward lower-paid job categories. (This is all in the first decade, 1987-1996, however.) This way of looking at things makes sense if we think the underlying wage-setting process, whatever it is, operates in terms of a basket of consumption goods.
This invites another question: How true is it that nominal wages move with inflation?
Conventional economics wisdom suggests we can separate wages into nominal and "real" components. This is on two not quite consistent grounds. First, we might suppose that workers and employers are implicitly negotiating contracts in terms of a fixe quantity of labor time for, on the one hand, a basket of wage goods, and on the other, a basket of produced goods (which will be traded for consumption good for the employer). This contract only incidentally happens to be stated in terms of money. The ultimate terms on which consumption goods for the workers exchange with consumption goods for the employer should not be affected by the units the trade happens to be denominated in. (In this respect the labor contract is just like any other contract.) This is the idea behind Milton Friedman's "natural rate of unemployment" hypothesis. In Friedman's story, causality runs strictly from inflation to unemployment. High inflation is not immediately recognized by workers, leading them to overestimate the basket of goods their wages will buy. So they work more hours than they would have chosen if they had correctly understood the situation. From this point of view, there's no cost to low unemployment in itself; the problem is just that unemployment will only be low if high inflation has tricked workers into supply too much labor. Needless to say, this is not the way anyone in the policy world thinks about the inflation-unemployment nexus today, even if they continue to use Friedman's natural rate language.
The alternative view is that workers and employers negotiate a money-wage, and then output prices are set as a markup over that wage. In this story, causality runs from unemployment to inflation. While Friedman thought an appropriate money-supply growth rate was the necessary and sufficient condition for stable prices, with any affect on unemployment just collateral damage from changes in inflation, in this story keeping unemployment at an appropriate level is a requirement for stabilizing prices. This is the policy orthodoxy today. (So while people often say that NAIRU is just another name for the natural rate of unemployment, in fact they are different concepts.) I think there are serious conceptual difficulties with the orthodox view, but we'll save those for another time. Suffice it to say that causality is supposed to run from low unemployment, to faster nominal wage growth, to higher inflation. So the question is: Is it really the case that faster nominal wage growth is associated with higher inflation?
A simple scatterplot suggests a fairly tight relationship, especially at higher levels of wage growth and inflation. But if we split the postwar period at 1985, things look very different. In the first period, there's a close relationship — regressing inflation on nominal wage growth gives an R-squared of 0.81. (Although even then the coefficient is significantly less than 1.)
Since 1985, though, the relationship is much looser, with an R-squared of 0.12. And even is that driven almost entirely by period of falling wages and prices in 2009; remove that and the correlation is essentially zero.
So while it was formerly true that changes in inflation were passed one for one into changes in nominal wages, and/or changes in nominal wage growth led to similar changes in inflation, neither of those things has been true for quite a while now. In recent decades, faster nominal wage growth does not translate into higher inflation.
Obviously, a few scatterplots aren't dispositive, but they are suggestive. So supposing that there has been a delinking of wage growth and inflation, what conclusions might we draw? I can think of a couple.
On the one hand, maybe we shouldn't be so dismissive of the naive view that inflation reduces the standard of living directly, by raising the costs of consumption goods while incomes are unchanged. There seems to be an emerging conventional wisdom in this vicinity. Here for instance is Gillian Tett in the FT, endorsing the BIS view that there's nothing wrong with falling prices as long as asset prices stay high. (Priorities.) In the view of both Keynes (in the GT; he modified it later) and Schumpeter, inflation was associated with higher nominal but lower real wages, deflation with lower nominal but higher real wages. I think this may have been true in the 19th century. It's not impossible it could be true in the future.
On the other hand. If the mission of central banks is price stability, and if there is no reliable association between changes in wage growth and changes in inflation, then it is hard to see the argument for tightening in response to falling unemployment. You really should wait for direct evidence of rising inflation. Yet central banks are as focused on unemployment as ever.
It's perhaps significant in this regard that the authorities in Europe are shifting away from the NAIRU (Non-Accelerating Inflation Rate of Unemployment) and increasingly talking about the NAWRU (Non-Accelerating Wage Rate of Unemployment). If the goal all along has been lower wage growth, then this is what you should expect: When the link between wages and inflation weakens, the response is not to find other tools for controlling inflation, but other arguments for controlling wages. This may be the real content of the "competitiveness" discourse. Elevating competitiveness over price stability as overarching goal of policy lets you keep pushing down wages even when inflation is already low.
Worth noting here: While the ECB's "surrender Dorothy" letter to the Spanish government ordered them to get rid of price indexing, their justification was not, as you might expect, that indexation contributes to inflationary spirals. Rather it was that it is "a structural obstacle to the adjustment of labour costs" and "contribute to hampering competitiveness." [4] This is interesting. In the old days we would have said, wage indexing is bad because it won't affect real wages, it just leads to higher inflation. But apparently in the new dispensation, we say that wage indexing is bad precisely because it does affect real wages.
[1] This might seem to contradict the previous point but it doesn't, it's just that the post-2009 recovery period includes both a negative composition shift in 2008-2009, when unemployment was high, and a positive compositional shift in 2014, which cancel each other out.
[2] From A Theory of Employment: "Except under peculiar conditions, a decline in effective demand which reduces the amount of employment offered in the general run of industries will not lead to 'unemployment' in the sense of complete idleness, but will rather drive workers into a number of occupations [such as] selling match-boxes in the Strand, cutting brushwood in the jungles, digging potatoes on allotments which are still open to them. A decline in one sort of employment leads to an increase in another sort, and at first sight it may appear that, in such a case, a decline in effective demand does not cause unemployment at all. But the matter must be more closely examined. In all those occupations which the dismissed workers take up, their productivity is less than in the occupations that they have left."
[3] The only piece I know of that makes the connection between demand and productivity variation across sectors is this excellent article by John Eatwell (which unfortunately doesn't seem to be available online), but it is focused on long run variation, not cyclical.
[4] The ECB's English is not the most felicitous, is it? The Spanish version is "contribuyen a dificultar la competitividad y el crecimiento," which also doesn't strike me as a phrase that a native speaker would write. Maybe it sounds better in the original German.
The BLS explains the difference between the two measures:
The Employment Cost Index, or ECI, measures changes in employers’ cost of compensating workers, controlling for changes in the industrial-occupational composition of jobs. … The ECI is intended to indicate how the average compensation paid by employers would have changed over time if the industrial-occupational composition of employment had not changed… [It] controls for employment shifts across 2-digit industries and major occupations. The Employer Costs for Employee Compensation, or ECEC… is designed to measure the average cost of employee compensation. Accordingly, the ECEC is calculated by multiplying each job quote by its sample weight.In other words, the ECI measures the change in average hourly compensation, controlling for shifts in the mix of industries and occupations. The ECEC simply measures the overall change in hourly compensation, including the effects of both changes in compensation for particular jobs, and changes in the mix of jobs.
Here are the two series for the full period both are available (1987-2014), both raw and adjusted for inflation ("real").
What do we learn from this?
First, the two series are closely correlated. This tells us that most of the variation in compensation is driven by changes within occupations and sectors, not by shifts in employment between occupations and sectors. This is clearly true at annual frequencies but it seems to be true over longer periods as well. For instance, let's compare the behavior of compensation in the five years since the end of the recession to the last period of strong wage growth, 1997-2004. The difference between the two periods in the average annual increase in nominal wages is almost exactly the same according to the two indexes — 2.7 points by the ECI, 2.6 points by the ECEC. In other words, slower wage growth in the recent period is entirely due to slower wages growth within particular kinds of jobs. Shifts in the composition of jobs have played no role at all.
On the face of it, the fact that almost all variation in aggregate compensation is driven by changes within employment categories, seems to favor a labor/political story of slower wage growth as opposed to a China or robots story. The most obvious versions of the latter two stories involve a disproportionate loss of high-wage jobs, whereas stories about weaker bargaining position of labor predict slower compensation growth within job categories. I wouldn't ask this one piece of evidence to carry a lot of weight in that debate. (I think it's stronger evidence against a skills-based explanation of slower wage growth.)
While the two series in general move together, the ECEC is more strongly cyclical. In other words, during periods of high unemployment and falling wages in general, there is also a shift in the composition of employment towards lower-paid occupations. And during booms, when unemployment is low and wages are rising in general, there is a shift in the direction of higher-paid job categories. [1] Insofar as wages and labor productivity are correlated, this cyclical shift between higher-wage and lower-wage sectors could help explain why employment is more stable than output. I've had the idea for a while that the Okun's law relationship -- the less than one-for-one correlation between employment and output growth -- reflects not only hiring/firing costs and overhead labor, but also shifts in the composition of employment in response to demand. In other words, in addition to employment adjustment costs at the level of individual enterprises, the Okun coefficient reflects cyclically varying degrees of "disguised unemployment" in Joan Robinson's sense. [2] This is an argument I'd like to develop properly someday, since it seems fairly obvious, potentially important and empirically tractable, and I haven't seen anyone else make it. [3] (I'm sure someone has.)
What's going on in the most recent year? Evidently, there has been no acceleration of wage growth for a given job, but the mix of jobs created has shifted toward higher-wage categories. This suggests that to the extent wages are rising faster, it's not a sign of labor-market pressures. (Some guy from Deutsche Bank interprets the same divergence as support for raising rates, which it's hard not to feel is deliberately dishonest.) As for which particular higher-wage job categories are growing more rapidly -- I don't know. And, what's going on in 1995? That year has by far the biggest divergence between the two series. It could well be an artifact of some kind, but if not, seems important. A large fall in the ECEC relative to the ECI could be a signature of deindustrialization. I'm not exploring the question further now (those exams…) but it would be interesting to ask analogous question with some series that extends earlier. It's likely that if we were looking at the 1970s-1980s, we would find a much larger share of variation in wage growth explained by compositional shifts.
Should we adjust for inflation? I give the "real" series here, but I am in general skeptical that there is any sense in which an ex post adjustment of money flows for inflation is more real than, say, The Real World on MTV. I am even more doubtful than usual in this case, because we are normally told to think that changes in nominal wages are the main determinant of inflation. Obviously in that case we have to think of the underlying labor-market process as determining a change in nominal wage. Still, if we do compute a "real" index, things look a little different. Real ECI rises 14 percent over the full 1987-2014 period, while real ECEC rises only 5 percent. So now we can say that about two-thirds of the increase in real wages within particular job categories over the past three decades, was offset by a shift in the composition of employment toward lower-paid job categories. (This is all in the first decade, 1987-1996, however.) This way of looking at things makes sense if we think the underlying wage-setting process, whatever it is, operates in terms of a basket of consumption goods.
This invites another question: How true is it that nominal wages move with inflation?
Conventional economics wisdom suggests we can separate wages into nominal and "real" components. This is on two not quite consistent grounds. First, we might suppose that workers and employers are implicitly negotiating contracts in terms of a fixe quantity of labor time for, on the one hand, a basket of wage goods, and on the other, a basket of produced goods (which will be traded for consumption good for the employer). This contract only incidentally happens to be stated in terms of money. The ultimate terms on which consumption goods for the workers exchange with consumption goods for the employer should not be affected by the units the trade happens to be denominated in. (In this respect the labor contract is just like any other contract.) This is the idea behind Milton Friedman's "natural rate of unemployment" hypothesis. In Friedman's story, causality runs strictly from inflation to unemployment. High inflation is not immediately recognized by workers, leading them to overestimate the basket of goods their wages will buy. So they work more hours than they would have chosen if they had correctly understood the situation. From this point of view, there's no cost to low unemployment in itself; the problem is just that unemployment will only be low if high inflation has tricked workers into supply too much labor. Needless to say, this is not the way anyone in the policy world thinks about the inflation-unemployment nexus today, even if they continue to use Friedman's natural rate language.
The alternative view is that workers and employers negotiate a money-wage, and then output prices are set as a markup over that wage. In this story, causality runs from unemployment to inflation. While Friedman thought an appropriate money-supply growth rate was the necessary and sufficient condition for stable prices, with any affect on unemployment just collateral damage from changes in inflation, in this story keeping unemployment at an appropriate level is a requirement for stabilizing prices. This is the policy orthodoxy today. (So while people often say that NAIRU is just another name for the natural rate of unemployment, in fact they are different concepts.) I think there are serious conceptual difficulties with the orthodox view, but we'll save those for another time. Suffice it to say that causality is supposed to run from low unemployment, to faster nominal wage growth, to higher inflation. So the question is: Is it really the case that faster nominal wage growth is associated with higher inflation?
 |
| Wage Growth and Inflation, 1947-2014 |
A simple scatterplot suggests a fairly tight relationship, especially at higher levels of wage growth and inflation. But if we split the postwar period at 1985, things look very different. In the first period, there's a close relationship — regressing inflation on nominal wage growth gives an R-squared of 0.81. (Although even then the coefficient is significantly less than 1.)
 |
| Wage Growth and Inflation, 1947-1985 |
Since 1985, though, the relationship is much looser, with an R-squared of 0.12. And even is that driven almost entirely by period of falling wages and prices in 2009; remove that and the correlation is essentially zero.
 |
| Wage Growth and Inflation, 1986-2014 |
So while it was formerly true that changes in inflation were passed one for one into changes in nominal wages, and/or changes in nominal wage growth led to similar changes in inflation, neither of those things has been true for quite a while now. In recent decades, faster nominal wage growth does not translate into higher inflation.
Obviously, a few scatterplots aren't dispositive, but they are suggestive. So supposing that there has been a delinking of wage growth and inflation, what conclusions might we draw? I can think of a couple.
On the one hand, maybe we shouldn't be so dismissive of the naive view that inflation reduces the standard of living directly, by raising the costs of consumption goods while incomes are unchanged. There seems to be an emerging conventional wisdom in this vicinity. Here for instance is Gillian Tett in the FT, endorsing the BIS view that there's nothing wrong with falling prices as long as asset prices stay high. (Priorities.) In the view of both Keynes (in the GT; he modified it later) and Schumpeter, inflation was associated with higher nominal but lower real wages, deflation with lower nominal but higher real wages. I think this may have been true in the 19th century. It's not impossible it could be true in the future.
On the other hand. If the mission of central banks is price stability, and if there is no reliable association between changes in wage growth and changes in inflation, then it is hard to see the argument for tightening in response to falling unemployment. You really should wait for direct evidence of rising inflation. Yet central banks are as focused on unemployment as ever.
It's perhaps significant in this regard that the authorities in Europe are shifting away from the NAIRU (Non-Accelerating Inflation Rate of Unemployment) and increasingly talking about the NAWRU (Non-Accelerating Wage Rate of Unemployment). If the goal all along has been lower wage growth, then this is what you should expect: When the link between wages and inflation weakens, the response is not to find other tools for controlling inflation, but other arguments for controlling wages. This may be the real content of the "competitiveness" discourse. Elevating competitiveness over price stability as overarching goal of policy lets you keep pushing down wages even when inflation is already low.
Worth noting here: While the ECB's "surrender Dorothy" letter to the Spanish government ordered them to get rid of price indexing, their justification was not, as you might expect, that indexation contributes to inflationary spirals. Rather it was that it is "a structural obstacle to the adjustment of labour costs" and "contribute to hampering competitiveness." [4] This is interesting. In the old days we would have said, wage indexing is bad because it won't affect real wages, it just leads to higher inflation. But apparently in the new dispensation, we say that wage indexing is bad precisely because it does affect real wages.
[1] This might seem to contradict the previous point but it doesn't, it's just that the post-2009 recovery period includes both a negative composition shift in 2008-2009, when unemployment was high, and a positive compositional shift in 2014, which cancel each other out.
[2] From A Theory of Employment: "Except under peculiar conditions, a decline in effective demand which reduces the amount of employment offered in the general run of industries will not lead to 'unemployment' in the sense of complete idleness, but will rather drive workers into a number of occupations [such as] selling match-boxes in the Strand, cutting brushwood in the jungles, digging potatoes on allotments which are still open to them. A decline in one sort of employment leads to an increase in another sort, and at first sight it may appear that, in such a case, a decline in effective demand does not cause unemployment at all. But the matter must be more closely examined. In all those occupations which the dismissed workers take up, their productivity is less than in the occupations that they have left."
[3] The only piece I know of that makes the connection between demand and productivity variation across sectors is this excellent article by John Eatwell (which unfortunately doesn't seem to be available online), but it is focused on long run variation, not cyclical.
[4] The ECB's English is not the most felicitous, is it? The Spanish version is "contribuyen a dificultar la competitividad y el crecimiento," which also doesn't strike me as a phrase that a native speaker would write. Maybe it sounds better in the original German.
Sunday, March 22, 2015
A Most Violent Year
I just watched this movie.
Oscar Isaacs plays the owner of a fuel oil company in 1981, the peak year of violent crime in New York City. Needless to say, it's an industry in which organized crime is salient, in real life and of course double in the movies. But he just wants to sell fuel oil. One way of looking at it, is it's The Sopranos from the point of view of the people they preyed on. Another way, it's the kind of movie Deirdre McCloskey used to call for, a celebration of bourgeois virtue. I don't know if McCloskey would like the results in this particular case. What's very clear here is how much bourgeois virtue depends on, or is constituted by, its dialectical relationship with the liberal order on the one hand, the rule of law; and on the other hand the personal loyalties of family and tribe. Your status as a business owner depends on your relationship to your wife, children, in-laws, on the one hand, and to the agents of the state on the other. The capitalist is always an embodied human being, never the pure personification of capital. (It's worth noting that Isaacs' key counterparties are a Hasidic clan and a grandfather-granddaughter operation.)
We also see the void at the heart of the capitalist ethic. Several times, other characters ask Isaacs why it's so important to him that his business keep growing. His answers range from "Just because" to "I don't understand the question." These exchanges reminded me of a line from Nietzsche that Bob Fitch used to describe real estate speculators:
The depiction of New York back in the day feels real. The dialogue is smart and the camerawork and sound are effective, in my uniformed judgement. It's a good movie, I recommend it.
Oscar Isaacs plays the owner of a fuel oil company in 1981, the peak year of violent crime in New York City. Needless to say, it's an industry in which organized crime is salient, in real life and of course double in the movies. But he just wants to sell fuel oil. One way of looking at it, is it's The Sopranos from the point of view of the people they preyed on. Another way, it's the kind of movie Deirdre McCloskey used to call for, a celebration of bourgeois virtue. I don't know if McCloskey would like the results in this particular case. What's very clear here is how much bourgeois virtue depends on, or is constituted by, its dialectical relationship with the liberal order on the one hand, the rule of law; and on the other hand the personal loyalties of family and tribe. Your status as a business owner depends on your relationship to your wife, children, in-laws, on the one hand, and to the agents of the state on the other. The capitalist is always an embodied human being, never the pure personification of capital. (It's worth noting that Isaacs' key counterparties are a Hasidic clan and a grandfather-granddaughter operation.)
We also see the void at the heart of the capitalist ethic. Several times, other characters ask Isaacs why it's so important to him that his business keep growing. His answers range from "Just because" to "I don't understand the question." These exchanges reminded me of a line from Nietzsche that Bob Fitch used to describe real estate speculators:
We must not ask the money-making banker the reason for his restless activity, it is foolish. The active roll as the stone rolls, according to the stupidity of mechanics.Isaacs' performance is quite affecting, and it's clear that his character has real human connections to his family, his employees, and his business peers. That only makes it more effective when we see how much his concrete choices come down to "the stupidity of mechanics."
The depiction of New York back in the day feels real. The dialogue is smart and the camerawork and sound are effective, in my uniformed judgement. It's a good movie, I recommend it.
Saturday, March 21, 2015
A Quick Point on Models
According to Keynes the purpose of economics is "to provide ourselves with an organised and orderly method of thinking out particular problems"; it is "a way of thinking ... in terms of models joined to the art of choosing models which are relevant to the contemporary world." (Quoted here.)
I want to amplify on that just a bit. The test of a good model is not whether it corresponds to the true underlying structure of the world, but whether it usefully captures some of the regularities in the concrete phenomena we observe. There are lots of different regularities, more or less bounded in time, space and other dimensions, so we are going to need lots of different models, depending on the questions we are asking and the setting we are asking them in. Thus the need for the "art of choosing".
I don't think this point is controversial in the abstract. But people often lose sight of it. Obvious case: Piketty and "capital". A lot of the debate between Piketty and his critics on the left has focused on whether there really is, in some sense, a physical quantity of capital, or not. I don't think we need to have this argument.
We observe "capital" as a set of money claims, whose aggregate value varies in relation to other observable monetary aggregates (like income) over time and across space. There is a component of that variation that corresponds to the behavior of a physical stock -- increasing based on identifiable inflows (investment) and decreasing based on identifiable outflows (depreciation). Insofar as we are interested in that component of the observed variation, we can describe it using models of capital as a physical stock. The remaining components (the "residual" from the point of view of a model of physical K) will require a different set of models or stories. So the question is not, is there such a thing as a physical capital stock? It's not even, is it in general useful to think about capital as a physical stock? The question is, how much of the particular variation we are interested is accounted for by the component corresponding to the evolution of a physical stock? And the answer will depend on which variation we are interested in.
For example, Piketty could say "It's true that my model, which treats K as a physical stock, does not explain much of the historical variation in capital-output ratios at decadal frequencies, like the fall and rise over the course of the 20th century. But I believe it does explain very long-frequency variation, and in particular captures important long-run possibilities for the future." (I think he has in fact said something like this, though I can't find the quote at the moment.) You don't have to agree with him -- you could dispute that his model is a good fit for even the longest-frequency historical variation, or you could argue that the shorter frequency variation is more interesting (and is what his book often seems to be about). But it would be pointless to criticize him on the grounds that there isn't "really" such a thing as a physical capital stock, or that there is no consistent way in principle to measure it. That, to me, would show a basic misunderstanding of what models are.
An example of good scientific practice along these lines is biologists' habit of giving genes names for what happens when gross mutations are induced in them experimentally. Names like eyeless or shaggy or buttonhead: the fly lacks eyes, grows extra hair, or has a head without segments if the gene is removed. It might seem weird to describe genes in terms of what goes wrong when they are removed, as opposed to what they do normally, but I think this practice shows good judgement about what we do and don't know. In particular, it avoids any claim about what the gene is "for." There are many many relationships between a given locus in the genome and the phenotype, and no sense in which any of them is more or less important in an absolute sense. Calling it the "eye gene" would obscure that, make it sound like this is the relationship that exists out in the world, when for all we know the variation in eye development in wild populations is driven by variation in entirely other locuses. Calling it eyeless makes it clear that it's referring to what you observe in a particular experimental context.
EDIT: I hate discussions of methodology. I should not have written this post. (I only did because I liked the gene-naming analogy.) That said, if you, unlike me, enjoy this sort of thing, Tom Hickey wrote a long and thoughtful response to it. He mentions among others, Tony Lawson, who I would certainly want to read more of if I were going to write about this stuff.
Tuesday, March 10, 2015
Mark Blyth on the Creditor's Paradise
There's a lot to like in this talk by Mark Blyth, reposted in Jacobin. I will certainly be quoting him in the future on the euro system as a "creditor's paradise." But I can't help noting that the piece repeats exactly the two bits of conventional wisdom that I've been criticizing in my recent posts here on Europe. [1]
First, the uncritical adoption of the orthodox view that if Greece defaults on its debts to the euro system, it will have to leave the single currency. Admittedly it's just a line in passing. But I really wish that Blyth would not write "default or 'Grexit'," as if they were synonyms. Given that the assumption that they have to go together is one of the strongest weapons on the side of orthodoxy, opponents of austerity should at least pause a moment and ask if they necessarily do.
Second, this:
Obviously -- but I guess it isn't obvious -- I don't personally think that the shift toward trade surpluses throughout the eurozone represents any kind of improvement in the human condition. But it does directly falsify the claim Blyth is making here. And this is a problem if the stance we are trying to criticize austerity from is a neutral technocratic one, in which disagreements are about means rather than ends.
Austerity is part of the program of reinforcing and extending the logic of the market in political and social life. Personally I find that program repugnant. But on its own terms, austerity can work just fine.
[1] One of my posts was also cross-posted at Jacobin. Everybody should read Jacobin.
First, the uncritical adoption of the orthodox view that if Greece defaults on its debts to the euro system, it will have to leave the single currency. Admittedly it's just a line in passing. But I really wish that Blyth would not write "default or 'Grexit'," as if they were synonyms. Given that the assumption that they have to go together is one of the strongest weapons on the side of orthodoxy, opponents of austerity should at least pause a moment and ask if they necessarily do.
Second, this:
Austerity as economic policy simply doesn’t work. ... European reforms ... simply ask everyone to become “more competitive” — and who could be against that? Until one remembers that being competitive against each other’s main trading partners in the same currency union generates a “moving average” problem of continental proportions.
It is statistically absurd to all become more competitive. It’s like everyone trying to be above average. It sounds like a good idea until we think about the intelligence of the children in a classroom. By definition, someone has to be the “not bright” one, even in a class of geniuses.In comments to my last post, a couple people doubted if critics of austerity really say it's impossible for all the countries in the euro to become more competitive. If you were one of the doubters, here you go: Mark Blyth says exactly that. Notice the slippage in the referent of "everyone," from all countries in the euro system, to all countries in the world. Contra Blyth, since the eurozone is not a closed trading system, it is not inherently absurd to suggest that everyone in it can become more competitive. If competitiveness is measured by the trade balance, it's not only not absurd, it's an accomplished fact.
Obviously -- but I guess it isn't obvious -- I don't personally think that the shift toward trade surpluses throughout the eurozone represents any kind of improvement in the human condition. But it does directly falsify the claim Blyth is making here. And this is a problem if the stance we are trying to criticize austerity from is a neutral technocratic one, in which disagreements are about means rather than ends.
Austerity is part of the program of reinforcing and extending the logic of the market in political and social life. Personally I find that program repugnant. But on its own terms, austerity can work just fine.
[1] One of my posts was also cross-posted at Jacobin. Everybody should read Jacobin.
Monday, March 2, 2015
What Has Happened to Trade Balances in Europe?
It has gradually entered our awareness that the Greek trade account is now balanced. Greece no longer depends on financial markets (or official transfers, or remittances from workers abroad) to finance its imports. This is obviously important for negotiations with the "institutions," or at least it ought to be.
I was wondering, how general is this shift toward a positive trade balance. In the FT last week, Martin Wolf pointed out that over the past five years, the Euro area as a whole has shifted from modest trade deficits to substantial trade surpluses, equal to 3 percent of euro-area GDP in 2013. He does not break it down by country, though. I decided to do that.
Here, from Eurostat, are the export-import ratios for the euro countries in 2008 and 2013. Values greater than one on the horizontal axis represent a trade surplus in 2008; only a few northern European countries fall in that group. Meanwhile, in seven countries imports exceeded exports by 10 percent or more. By 2013, the large majority of the euro area is in surplus, while not a single country has an excess of imports over exports of more than 5 percent. The distance above the diagonal line indicates the improvement from 2008 to 2013; this is positive for every euro-area country except Austria, Finland and Luxembourg, and the biggest improvements are in the countries with the worst ratios in 2008. The surplus countries, apart from Finland, more or less maintained their surpluses; but the deficit countries all more or less eliminated their deficits.
So does this mean that austerity works? Yes and no. It is certainly true that Europe's deficit countries have all achieved positive trade balances in the past few years, even including countries like Greece whose trade deficits long predated the euro. On the other hand, it's also almost certainly true that this has more to do with the falls in domestic demand rather than any increase in competitiveness.
This is shown in the second figure, which gives the ratio of 2013 imports to 2008 exports on the vertical axis, and 2013 exports to 2008 imports on the horizontal axis. (This is in nominal euros.) Here a point on the diagonal line equals and equal growth rate of imports and exports. Most countries are clustered around 15% growth in imports and exports; these are the countries that had balanced trade or surpluses in 2008, and whose trade ratios have not changed much in the past five years. Only one country, Estonia, has export growth substantially above the European average. But all the former deficit countries have import growth much lower than average. (As indicated by their position to the left of the main cluster.) It's evident from this diagram that the move toward balanced trade in the deficit countries is about throttling back imports, not boosting exports. This suggests that it has more to do with slow income growth than with lower costs.
Still, the fact remains, trade deficits have almost been eliminated in the euro area. Liberal critics of the European establishment often say "not every country in Europe can be a net exporter" as if that were a truism. But it's not even true, not in principle and evidently not in practice. It turns out it is quite possible for every country in the euro to run a trade surplus.
The next question is, with whom has the euro area's trade balanced improved? Europe outside the euro, to begin with. The country with the biggest single increase in net imports from the euro zone is, surprisingly, Switzerland, whose deficit with the euro area has increased by close to 60 billion. Switzerland's annual trade deficit with the euro area is now 75 billion, about a quarter of the area's overall trade surplus. Norway and Turkey have increased their deficits by about 15 billion each. The rest of the increase in net exports are accounted for by increased surpluses with Africa (26 billion), the US (27 billion), and Latin America (35 billion, about half to Brazil), and a decreased deficit with Asia (135 billion, including a 55 billion smaller deficit with China, 30 billion smaller with Japan and 20 billion with Korea). Net exports to Australia have also increased by 10 billion.
Why do I bring this up? One, I haven't seen it discussed much and it is interesting.
But more importantly, the lesson of the Europe-wide shift toward trade surpluses is that austerity can succeed on its own terms. I think there's a tendency for liberal critics of austerity to assume that the people on the other side are just confused, or blinkered by ideology, and that there's something incoherent or self-contradictory about competitiveness as a Europe-wide organizing principle. There's a hope, I think, that economic logic will eventually compel policymakers to do what's right for everyone. Personally, I don't think that the masters of the euro care too much about the outcome of the struggle for competitiveness; it's the struggle itself -- and the constraints it imposes on public and private choices -- that matters. But insofar as the test of the success of austerity is the trade balance, I suspect austerity can succeed indefinitely.
UPDATE: In comments Kostas Kalaveras points to a report from the European Commission that includes a similar breakdown of changes in trade balances across the euro area. There's some useful data in there but the interpretation is that almost all the adjustment has been structural rather than cyclical. This is based on estimates of declining potential output in the periphery that I think are insane. But it's interesting to see how official Europe thinks about this stuff.
I was wondering, how general is this shift toward a positive trade balance. In the FT last week, Martin Wolf pointed out that over the past five years, the Euro area as a whole has shifted from modest trade deficits to substantial trade surpluses, equal to 3 percent of euro-area GDP in 2013. He does not break it down by country, though. I decided to do that.
 |
| Euro area trade ratios, 2008 and 2013. The size of the dots is proportional to total 2008 trade. |
Here, from Eurostat, are the export-import ratios for the euro countries in 2008 and 2013. Values greater than one on the horizontal axis represent a trade surplus in 2008; only a few northern European countries fall in that group. Meanwhile, in seven countries imports exceeded exports by 10 percent or more. By 2013, the large majority of the euro area is in surplus, while not a single country has an excess of imports over exports of more than 5 percent. The distance above the diagonal line indicates the improvement from 2008 to 2013; this is positive for every euro-area country except Austria, Finland and Luxembourg, and the biggest improvements are in the countries with the worst ratios in 2008. The surplus countries, apart from Finland, more or less maintained their surpluses; but the deficit countries all more or less eliminated their deficits.
So does this mean that austerity works? Yes and no. It is certainly true that Europe's deficit countries have all achieved positive trade balances in the past few years, even including countries like Greece whose trade deficits long predated the euro. On the other hand, it's also almost certainly true that this has more to do with the falls in domestic demand rather than any increase in competitiveness.
This is shown in the second figure, which gives the ratio of 2013 imports to 2008 exports on the vertical axis, and 2013 exports to 2008 imports on the horizontal axis. (This is in nominal euros.) Here a point on the diagonal line equals and equal growth rate of imports and exports. Most countries are clustered around 15% growth in imports and exports; these are the countries that had balanced trade or surpluses in 2008, and whose trade ratios have not changed much in the past five years. Only one country, Estonia, has export growth substantially above the European average. But all the former deficit countries have import growth much lower than average. (As indicated by their position to the left of the main cluster.) It's evident from this diagram that the move toward balanced trade in the deficit countries is about throttling back imports, not boosting exports. This suggests that it has more to do with slow income growth than with lower costs.
 |
| Again, the sizes of the dots are proportional to 2008 trade volumes. |
Still, the fact remains, trade deficits have almost been eliminated in the euro area. Liberal critics of the European establishment often say "not every country in Europe can be a net exporter" as if that were a truism. But it's not even true, not in principle and evidently not in practice. It turns out it is quite possible for every country in the euro to run a trade surplus.
The next question is, with whom has the euro area's trade balanced improved? Europe outside the euro, to begin with. The country with the biggest single increase in net imports from the euro zone is, surprisingly, Switzerland, whose deficit with the euro area has increased by close to 60 billion. Switzerland's annual trade deficit with the euro area is now 75 billion, about a quarter of the area's overall trade surplus. Norway and Turkey have increased their deficits by about 15 billion each. The rest of the increase in net exports are accounted for by increased surpluses with Africa (26 billion), the US (27 billion), and Latin America (35 billion, about half to Brazil), and a decreased deficit with Asia (135 billion, including a 55 billion smaller deficit with China, 30 billion smaller with Japan and 20 billion with Korea). Net exports to Australia have also increased by 10 billion.
Why do I bring this up? One, I haven't seen it discussed much and it is interesting.
But more importantly, the lesson of the Europe-wide shift toward trade surpluses is that austerity can succeed on its own terms. I think there's a tendency for liberal critics of austerity to assume that the people on the other side are just confused, or blinkered by ideology, and that there's something incoherent or self-contradictory about competitiveness as a Europe-wide organizing principle. There's a hope, I think, that economic logic will eventually compel policymakers to do what's right for everyone. Personally, I don't think that the masters of the euro care too much about the outcome of the struggle for competitiveness; it's the struggle itself -- and the constraints it imposes on public and private choices -- that matters. But insofar as the test of the success of austerity is the trade balance, I suspect austerity can succeed indefinitely.
UPDATE: In comments Kostas Kalaveras points to a report from the European Commission that includes a similar breakdown of changes in trade balances across the euro area. There's some useful data in there but the interpretation is that almost all the adjustment has been structural rather than cyclical. This is based on estimates of declining potential output in the periphery that I think are insane. But it's interesting to see how official Europe thinks about this stuff.
Subscribe to:
Posts (Atom)